2. Council Tax for 2026/27
Bexley’s Council Tax requirement will result in a Council Tax for band D property with two residents of £2,366.36 in 2026/27. A comparison of Bexley’s and the Greater London Authority’s Council Tax for 2025/26 with last year is shown in the table below.
| Taxing Authority | 2025/26 | 2026/27 | Change |
|---|---|---|---|
| London Borough of Bexley | £1,767.65 | £1,855.85 | 4.99% |
| Greater London Authority | £490.38 | £510.51 | 4.10% |
| Total Tax at Band D | £2,258.03 | £2,366.36 | 4.80% |
| Band | Valuation Band | 2025/26 | 2026/27 |
|---|---|---|---|
| A | Up to and including £40,000 | £1,505.35 | £1,577.57 |
| B | £40,001 - £52,000 | £1,756.25 | £1,840.50 |
| C | £52,001 - £68,000 | £2,007.13 | £2,103.43 |
| D | £68,001 - £88,000 | £2,258.03 | £2,366.36 |
| E | £88,001 - £120,000 | £2,759.81 | £2,892.22 |
| F | £120,001 - £160,000 | £3,261.60 | £3,418.07 |
| G | £160,001 - £320,000 | £3,763.38 | £3,943.93 |
| H | More than £320,000 | £4,516.06 | £4,732.72 |
Image

Image

Image

Image
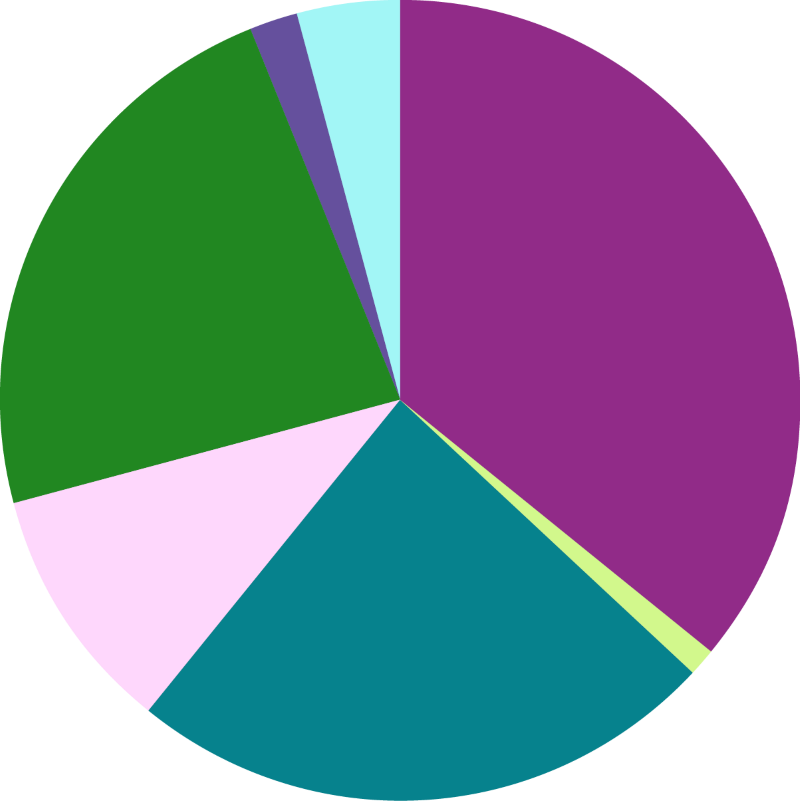
| Service | Per £1 |
|---|---|
Adult Social Care and Public Health | 36p |
Chief Executive | 1p |
Children and Education | 24p |
Finance and Corporate | 10p |
Places, Communities and Infrastructure | 23p |
Levies | 2p |
Financing Costs and Contingency | 4p |
| Total | £1 |
Image
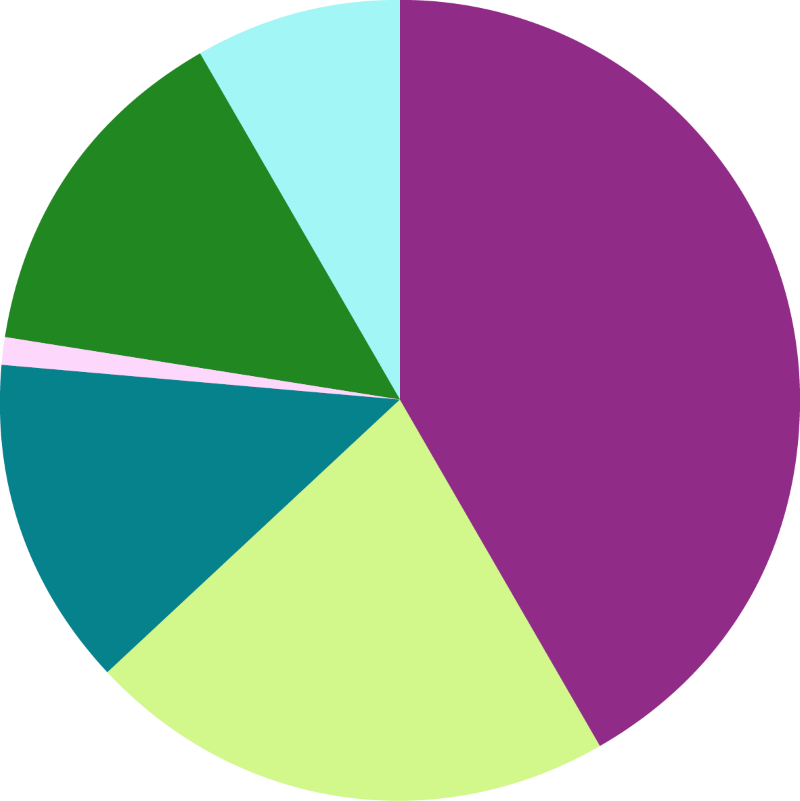
| Funding Source | Per £1 |
|---|---|
Council Tax | 41p |
Income from Business Rates and Revenue Support Grant | 23p |
Government and Other Grants | 13p |
Use of Reserves, Balances and Collection Fund Surplus | 1p |
Fees, Charges and Rent | 14p |
Other Income | 8p |
| Total | £1 |
Image

| Year | Gap (£m) |
|---|---|
| 2027/28 | 8.192 |
| 2028/29 | 14.352 |
| 2029/30 | 17.815 |