
Contents
- Introduction to the Pension Fund Annual Report 2023 to 2024
- Governance Arrangements
- Scheme Management and Advisors
- Risk Management
- Financial Performance
- Administration Management Performance
- Investment Policy and Performance
- Corporate Governance
- Scheme Administration
- Pension Fund Accounts 2023 to 2024
- Asset Pool Background and Governance
- Glossary of Terms
- Contact information
- Appendices
- Annual Report of the Pension Board 2023 to 2024
Administration Management Performance
The administration of the Fund is managed by London Borough of Bexley Council and undertaken by Local Pensions Partnership Administration (LPPA) under a contractual arrangement for them to carry out the day-to-day administration of pension records, calculate benefits, provide a website and produce other documentation. Pension payments are made by LPPA. The Fund does not include teachers, fire-fighters and police officers who have separate pension arrangements.
Further information on the performance can be found in the appendices.
Performance Indicators
The administration contract includes a number of performance indicators included to ensure that service to members of the Pension Fund is effective. This membership generates a considerable workload for the fund administrators (LPPA). A breakdown of the cases completed up until end 31 March 2024 and the percentage completed on time are shown in the table below:
| Type of Case | SLA Target (Working Days) | Total Processed | Performance 2022/23 | Total on Time | Target | Difference from Target* |
|---|---|---|---|---|---|---|
| New Starters | 10 | 696 | 100.0% | 696 | 95.0% | 5.0% |
| Transfer In | 10 | 187 | 96.3% | 180 | 95.0% | 1.3% |
| Transfer Out | 10 | 433 | 97.2% | 421 | 95.0% | 2.2% |
| Estimates | 10 | 143 | 95.8% | 137 | 95.0% | 0.8% |
| Deferred Benefits | 15 | 388 | 97.2% | 377 | 95.0% | 2.2% |
| Deaths | 5 | 337 | 97.8% | 330 | 95.0% | 2.8% |
| Retirements (Active) | 5 | 404 | 93.3% | 377 | 95.0% | -1.7%* |
| Retirements (Deferred) | 5 | 493 | 96.8% | 477 | 95.0% | 1.8% |
| Refunds | 5 | 342 | 91.4% | 313 | 95.0% | -3.6%* |
| Correspondence | 10 | 319 | 98.7% | 315 | 95.0% | 3.7% |
| Aggregation | 10 | 395 | 98.5% | 389 | 95.0% | 3.5% |
| Other** | Various | 929 | 98.8% | 918 | 95.0% | 3.8% |
*(-) denotes a decrease against the target
**’Other’ covers cases including, but not limited to:
- benefit revisions
- maternity/paternity cases
- ill health cases
- scheme opt-out cases
- My Pension Online registration queries
- P60 queries
- 50/50 scheme changes
- APC/AVC queries
LPPA's overall SLA performance has been 97.3% for the year, showing better results since 2022/23, when the migration to the new pension administration system occurred. Whilst the performance has been better, the Pension Fund will continue to monitor performance levels and raise any concerns if they are below target.
Complaints Received
The pension administrators occasionally deal with members of the fund who dispute an aspect of their pension benefits. These cases are dealt with by the Internal Dispute Resolution Procedure.
Helpdesk Satisfaction
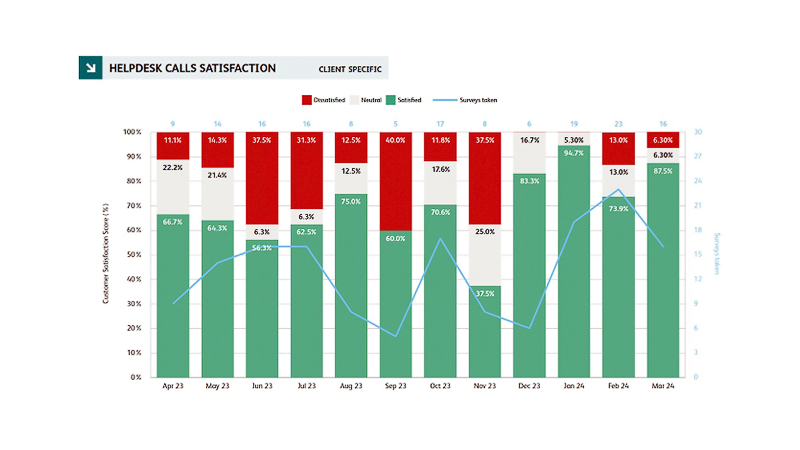
Figures provided in table format
| Month/year | % Dissatisfied | % Neutral | % Satisfied |
|---|---|---|---|
| April 2023 | 11.1 | 22.2 | 66.7 |
| May 2023 | 14.3 | 21.4 | 64.3 |
| June 2023 | 37.5 | 6.3 | 56.3 |
| July 2023 | 31.3 | 6.3 | 62.5 |
| August 2023 | 12.5 | 12.5 | 75.0 |
| September 2023 | 40.0 | 0.0 | 60.0 |
| October 2023 | 11.8 | 17.6 | 70.6 |
| November 2023 | 37.5 | 25.0 | 37.5 |
| December 2023 | 0.0 | 16.7 | 83.3 |
| January 2024 | 0.0 | 5.3 | 94.7 |
| February 2024 | 13.0 | 13.0 | 73.9 |
| March 2024 | 6.30 | 6.30 | 87.5 |
Pensions Helpdesk Performance
Performance across the Pensions Helpdesk is summarised below. The Helpdesk deals with all call and email enquiries from both members and employers that LPPA provide administration services for.
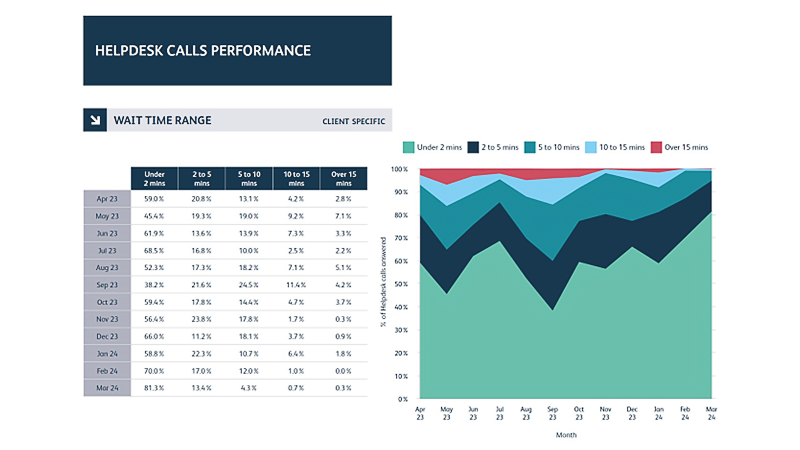
Figures provided in table format
| Month/year | % Under 2 minutes | % 2 to 5 minutes | % 5 to 10 minutes | % 10 to 15 minutes | % over 15 minutes |
|---|---|---|---|---|---|
| April 2023 | 59.0 | 20.8 | 13.1 | 4.2 | 2.8 |
| May 2023 | 45.4 | 19.3 | 19.0 | 9.2 | 7.1 |
| June 2023 | 61.9 | 13.6 | 13.9 | 7.3 | 3.3 |
| July 2023 | 68.5 | 16.8 | 10.0 | 2.5 | 2.2 |
| August 2023 | 52.3 | 17.3 | 18.2 | 7.1 | 5.1 |
| September 2023 | 38.2 | 21.6 | 24.5 | 11.4 | 4.2 |
| October 2023 | 59.4 | 17.8 | 14.4 | 4.7 | 3.7 |
| November 2023 | 56.4 | 23.8 | 17.8 | 1.7 | 0.3 |
| December 2023 | 66.0 | 11.2 | 18.1 | 3.7 | 0.9 |
| January 2024 | 58.8 | 22.3 | 10.7 | 6.4 | 1.8 |
| February 2024 | 70.0 | 17.0 | 12.0 | 1.0 | 0.0 |
| March 2024 | 81.3 | 13.4 | 4.3 | 0.7 | 0.3 |
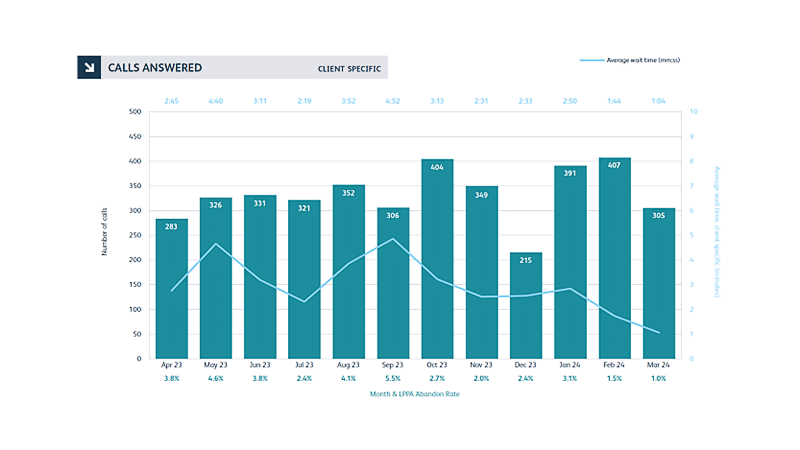
Figures provided in table format
| Month/year | Number of calls | Abandon rate % |
|---|---|---|
| April 2023 | 283 | 3.8 |
| May 2023 | 326 | 4.6 |
| June 2023 | 331 | 3.8 |
| July 2023 | 321 | 2.4 |
| August 2023 | 352 | 4.1 |
| September 2023 | 306 | 5.5 |
| October 2023 | 404 | 2.7 |
| November 2023 | 349 | 2.0 |
| December 2023 | 215 | 2.4 |
| January 2024 | 391 | 3.1 |
| February 2024 | 407 | 1.5 |
| March 2024 | 305 | 1.0 |
A complaints log is also maintained which indicates how matters have been resolved and whether any lessons can be learned from them. In 2023/2024 there were 64 complaints.
Satisfaction surveys and complaints are reported to Bexley and are discussed in service meetings with the Fund.
Scheme Administration Value for Money
The contract with LPPA is carefully monitored to ensure that the services provided are to the expected standards. Monthly and quarterly service meetings are held at which reports on service transactions are reviewed and customer service surveys considered. The LPPA uses the local government pensions software, Universal Pensions Management (UPM), produced by Civica Ltd. The LPPA allocate a total of 2 full time equivalent staff to the Bexley contract, but these come from a wide range of expertise that would not be available locally.
Bexley and LPPA seek to operate in the most efficient manner possible. The MHCLG/DLUHC publish the Government’s SF3 statistics covering aspects of pension fund administration. In the latest available statistics, those for 2022/23, the administrative costs per member in Bexley were £26.48 compared to the average of £27.85 across the LGPS funds in the England and Wales. Therefore, the Fund is achieving greater value for money from its administration function than its peers.
Membership Numbers and Trends
The membership of the Fund as at 31 March 2024 was as follows:
| 31 March 2020, in thousands of pounds | Number of employees in the Fund | 31 March 2021, in thousands of pounds |
|---|---|---|
| 2,307 | London Borough of Bexley | 2,498 |
| 3,473 | Other employers | 3,785 |
| 5,780 | Total | 6,283 |
| 31 March 2020, in thousands of pounds | Number of pensioners in the Fund | 31 March 2021, in thousands of pounds |
|---|---|---|
| 5,018 | London Borough of Bexley | 5,095 |
| 1,247 | Other employers | 1,356 |
| 6,265 | Total | 6,451 |
| 31 March 2020, in thousands of pounds | Number of deferred pensioners in the Fund | 31 March 2021, in thousands of pounds |
|---|---|---|
| 3,537 | London Borough of Bexley | 3,434 |
| 1,484 | Other employers | 1,579 |
| 5,021 | Total | 5,013 |
Active contributing member numbers increased by 9% over the course of the year from 2022/23 to 2023/34.
The graph below shows the membership of the Fund over the last five years:
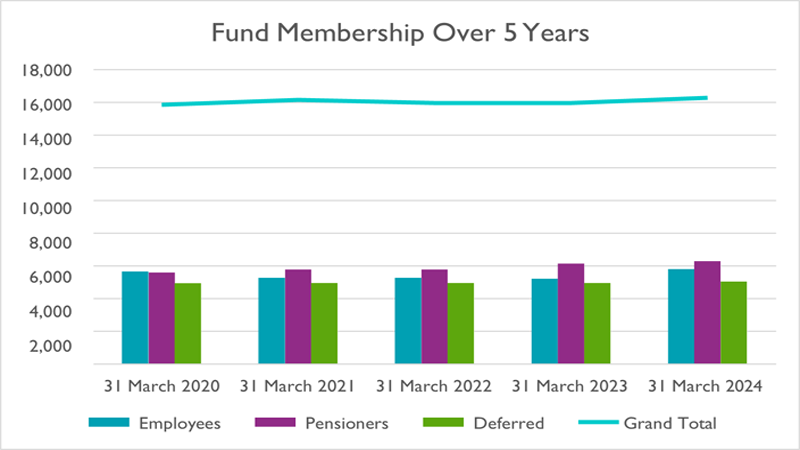
If you require more detailed information about this graph, please contact pensions@bexley.gov.uk
The graph below shows the age distribution of the membership as at 31 March 2024:
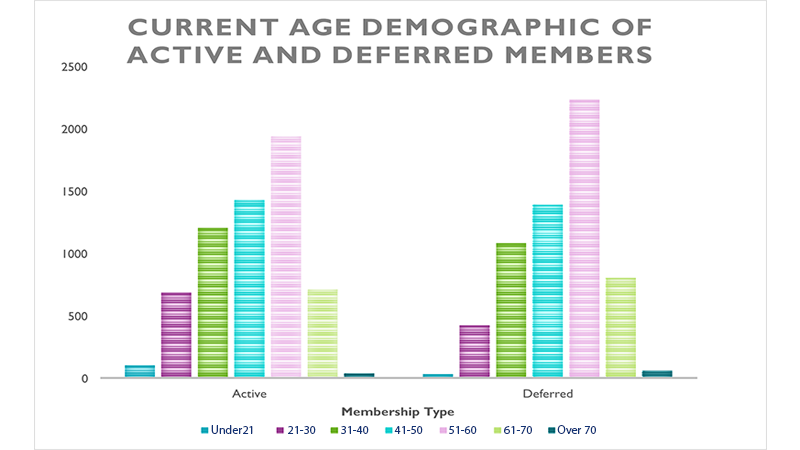
If you require more detailed information about this graph, please contact pensions@bexley.gov.uk
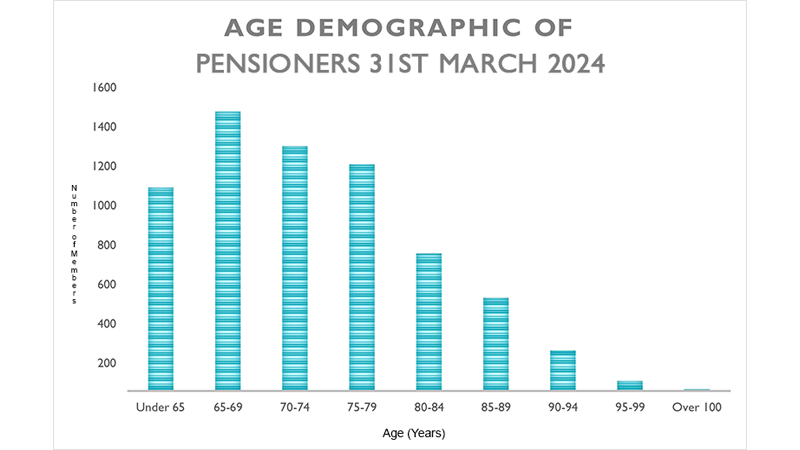
If you require more detailed information about this graph, please contact pensions@bexley.gov.uk
The table below shows the number of new pensioners during each of the last three years where an element of additional cost was incurred by the Pension Fund:
| Element of additional cost | 31 March 2021 | 31 March 2022 | 31 March 2023 | 31 March 2024 |
|---|---|---|---|---|
| Redundancy | 14 | 71 | 3 | 0 |
| Efficiency | 0 | 0 | 0 | 0 |
| Ill Health | 6 | 4 | 7 | 0 |
| Compassionate | 0 | 0 | 0 | 0 |
| Total | 20 | 75 | 10 | 0 |
Contributing Employers and Contributions Received
Below is a list of the current active contributing employers and the contributions received for 2023/24 (figures include early retirement and deficit funding contributions). The percentage or pensionable pay contributed by employers is determined on a triennial basis and covered in the Actuarial report. The last report was produced in 2022 and can be found on the Pensions page.
| Administering Authority | Employees Contributions in thousands of pounds | Employers Contributions in thousands of pounds | Total Contributions in thousands of pounds |
|---|---|---|---|
| London Borough of Bexley Council | (4,059) | (7,843) | (11,902) |
| Total Contributions from Administering Authority | (4,059) | (7,843) | (11,902) |
Scheduled Bodies
The Fund provides pensions not only for employees of London Borough of Bexley Council, but also for the employees of several scheduled and admitted bodies.
Scheduled bodies are organisations which have a statutory right to be a member of the Local Government Pension Scheme under the regulations e.g. academy schools.
| Scheduled Bodies | Employees Contributions in thousands of pounds | Employers Contributions in thousands of pounds | Total Contributions in thousands of pounds |
|---|---|---|---|
| Aspire Academy | (22) | (92) | (115) |
| Barnehurst Infants School | (16) | (58) | (74) |
| Barnehurst Junior School | (84) | (227) | (312) |
| Belmont Academy | (45) | (175) | (219) |
| Belvedere Infants School | (21) | (74) | (96) |
| Belvedere Junior School | (23) | (99) | (122) |
| BETHS | (81) | (282) | (363) |
| Bexley Co | (41) | (78) | (119) |
| Bexley Grammar School | (76) | (249) | (325) |
| Bexleyheath Academy | (44) | (214) | (258) |
| Blackfen Academy | (81) | (299) | (380) |
| Brampton School | (32) | (124) | (156) |
| Burnt Oak Junior School | (16) | (88) | (104) |
| Bursted Woods School | (42) | (152) | (195) |
| Castilion Academy | (17) | (65) | (82) |
| Chatsworth School | (16) | (78) | (93) |
| Chislehurst & Sidcup Grammar | (58) | (213) | (271) |
| Christ Church School | (43) | (179) | (222) |
| Cleeve Meadow School | (36) | (118) | (154) |
| Cleeve Park School | (93) | (336) | (429) |
| Cornerstone T | (20) | (71) | (91) |
| Cygnus Academies Trust | (80) | (248) | (329) |
| Days Lane School | (50) | (189) | (239) |
| East Wickham Infants Academy | (52) | (242) | (294) |
| Eastcote Primary School | (14) | (60) | (74) |
| Harris Academy Falconwood | (73) | (261) | (333) |
| Harris Gerrard Academy | (91) | (288) | (378) |
| Hillsgrove Primary School | (26) | (127) | (153) |
| Holy Trinity Lamorbey C.E. Primary | (16) | (71) | (87) |
| Hook Lane School | (39) | (148) | (187) |
| Hope Community School | (9) | (55) | (64) |
| Hurst Primary School | (44) | (194) | (238) |
| Hurstmere School | (60) | (226) | (286) |
| Jubilee Primary Academy | (19) | (105) | (124) |
| King Henry Academy | (80) | (269) | (349) |
| Lessness School | (49) | (192) | (241) |
| Mayplace School | (47) | (197) | (244) |
| New Generation Schools Trust | (5) | (18) | (23) |
| New Horizons Academy | (57) | (357) | (414) |
| Normandy Primary School | (41) | (161) | (202) |
| Northwood Academy | (24) | (111) | (134) |
| Oakwood Academy | (39) | (147) | (186) |
| Old Bexley C of E Primary School | (68) | (266) | (334) |
| Pelham Primary Academy | (34) | (128) | (162) |
| Pioneer Academy Central* | (64) | (188) | (252) |
| Royal Park School | (35) | (148) | (183) |
| Shenstone Academy | (139) | (640) | (779) |
| Sherwood Park Primary School | (31) | (129) | (160) |
| Slade Green Academy | (47) | (197) | (244) |
| St Catherine's Academy | (67) | (284) | (351) |
| St Columba's Academy | (66) | (398) | (465) |
| St Michael's Academy | (14) | (61) | (75) |
| St Paulinus CofE Primary School | (13) | (60) | (73) |
| St Peter Chanel | (25) | (85) | (111) |
| St Thomas More | (23) | (83) | (106) |
| St Augustine of Canterbury School | (20) | (83) | (103) |
| The Ignis Academy Trust | (105) | (468) | (574) |
| The Woodland Academy Trust | (151) | (562) | (713) |
| Townley Grammar | (77) | (404) | (481) |
| Trinity Academy | (103) | (328) | (430) |
| Upland School* | 1 | 4 | 5 |
| Welling School | (97) | (361) | (458) |
| Woodside Academy | (82) | (286) | (368) |
| Total Contributions from Scheduled Bodies | (3,085) | (12,089) | (15,174) |
*School is combined with another in reporting
Admitted Bodies
Admitted bodies participate in the pension scheme via an admission agreement made between the Council and the employing organisation. Examples of admitted bodies are not for profit organisations linked to the Council and contractors who have taken on delivery of services with Council staff also transferred to third parties.
| Admitted Bodies | Employees Contributions in thousands of pounds | Employers Contributions in thousands of pounds | Total Contributions in thousands of pounds |
|---|---|---|---|
| AJM Healthcare | (4) | (14) | (18) |
| Avante** | (2) | (11) | (13) |
| Capita | (1) | (2) | (3) |
| Cherry Tree Nursery (GB) Ltd | (0) | (1) | (1) |
| Class Technology Solutions | (1) | (7) | (8) |
| Cleantec Services Ltd | (9) | (47) | (56) |
| Countrystyle | (109) | (377) | (486) |
| Danson Youth Trust | (5) | (23) | (28) |
| Harrison Catering Service Ltd | (1) | (3) | (3) |
| Inspire Community Trust | (23) | 0 | (23) |
| London & Quadrant** | (2) | (9) | (10) |
| London Hire | (2) | (10) | (12) |
| PCS Group Ltd Lessness | (3) | (16) | (19) |
| Purgo Supply Serv Ltd | (12) | (45) | (58) |
| Rose Bruford College | (91) | (278) | (369) |
| Serco* | 0 | 470 | 470 |
| STEELES PCS LTD | (1) | (3) | (4) |
| Tivoli | (16) | (52) | (68) |
| Total Contributions from Admitted Bodies | (283) | (428) | (711) |
* No active members. Employer contributions relate to funding of past liabilities.
**Contributions paid is termination payment. Employer has now exited the Fund.
Employer Analysis
*This body received an exit credit from the fund; ceased as at 31 March 2024
The following table summarises the number of employers in the fund analysed by scheduled bodies and admitted bodies which are active (with active members) and ceased (no active members but with some outstanding pensions liabilities).
| Employer Type | Active | Ceased | Total |
|---|---|---|---|
| Administering Authority | 1 | 0 | 1 |
| Scheduled Body | 60 | 2* | 62 |
| Admitted Body | 16 | 3 | 19 |
| Total | 77 | 5 | 82 |
*School joined with another for reporting purposes