
Contents
- Introduction to the Pension Fund Annual Report 2023 to 2024
- Governance Arrangements
- Scheme Management and Advisors
- Risk Management
- Financial Performance
- Administration Management Performance
- Investment Policy and Performance
- Corporate Governance
- Scheme Administration
- Pension Fund Accounts 2023 to 2024
- Asset Pool Background and Governance
- Glossary of Terms
- Contact information
- Appendices
- Annual Report of the Pension Board 2023 to 2024
Investment Policy and Performance
Investment Policy
The Pension Fund Committee sets out a broad statement of the principles it has employed in establishing its investment and funding strategy in the Investment Strategy Statement (ISS). The ISS has been updated following the asset allocation strategy review during 2021 and can be found in the Investment Strategy Statement.
The ISS sets out responsibilities relating to the overall investment policy of the Fund including:
- asset allocations
- restrictions on investment types
- methods of investment management
- performance monitoring
The ISS also sets out the Fund’s approach to responsible investment and corporate governance issues, and how the Fund demonstrates compliance with the “Myners Principles”. These Principles are a set of recommendations relating to the investment of pension funds originally prepared by Lord Myners in 2001 and subsequently endorsed by Government. The current version of the Myners Principles covers the following areas:
- effective decision making
- clear objectives
- risk & liabilities
- performance measurement
- responsible ownership
- transparency and reporting
For 2021/22, the LGPS (Management and Investment of Funds) Regulations 2016, requires the Fund to publish an Investment Strategy Statement (ISS), which replaces the Statement of Investment Principles.
The ISS addresses each of the objectives included in the 2016 Regulations, namely:
- the administering requirement to invest fund money in a wide range of instruments
- the administering authority’s assessment of the suitability of particular investments and types of investment
- the administering authority’s approach to risk, including the ways in which risks are to be measured and managed
- the administering authority’s approach to pooling investments, including the use of collective investment vehicles
- the administering authority’s policy on how social, environmental and governance considerations are taken into account in the selection, non-selection, retention and realisation of investments
Asset Allocation
The strategic asset allocation is agreed by the Pension Fund Committee and the Fund’s advisers. The allocation effective during the year ended 31 March 2024 was as follows:
| Benchmark % in thousands of pounds | Target Range % | |
|---|---|---|
| Global Equities | 30 | 20 - 40 |
| Total Equities | 30 | 20 - 40 |
| Global Bonds (inc Corporates) | 10 | 5 - 15 |
| UK Government Bonds | 15 | 10 - 15 |
| Multi-Asset Credit | 5 | 0 - 10 |
| Total Bonds | 30 | 20 - 40 |
| Property | 15 | 5 - 25 |
| Private Equity | 7 | 0 - 15 |
| Infrastructure | 8 | 0 - 15 |
| Renewable Infrastructure | 5 | 0 - 15 |
| Illiquid Credit | 5 | 0 - 15 |
| Total Alternatives | 40 | 20 - 50 |
| Total | 100 | 100 |
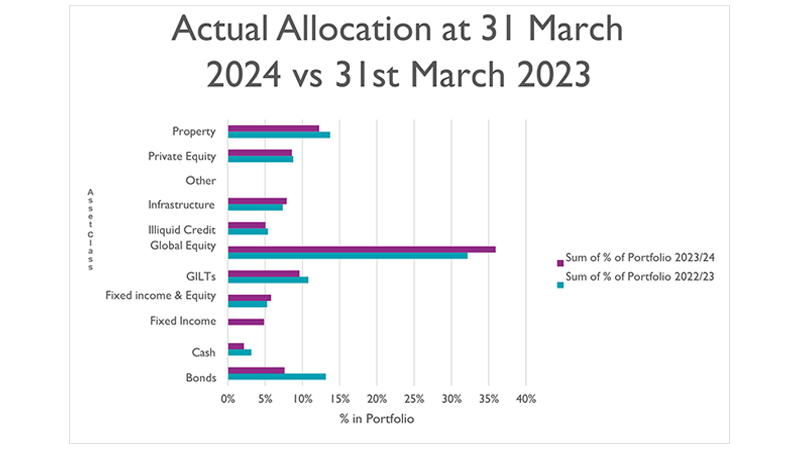
'Other' refers to the shareholding equity held in the pooling company (LCIV).
If you require more detailed information about this graph, please contact pensions@bexley.gov.uk
The Pension Fund Committee holds Fund Managers accountable for decisions on asset allocation within the Fund mandate under which they operate. In order to follow the Myners Principles, fund managers are challenged formally about asset allocation decisions.
Investment portfolios are reviewed at each Committee meeting in discussion with the investment adviser and officers, and fund managers are called to a Committee meeting if there are issues that need to be addressed. Officers meet fund managers regularly and advice is taken from the investment adviser on matters relating to fund manager arrangement and performance.
Fund managers provide a rationale for asset allocation decisions based upon their research resource in an effort to ensure that they are not simply tracking the peer group or relevant benchmark index. The Fund’s asset allocation strategy can be found in the ISS.
The asset allocation of the Pension Fund at the start and end of the financial year is set out below. These figures are based on market value and reflect the relative performance of investment markets and the impact of tactical asset allocation decisions made by the Pension Fund Committee.
Changes since 22/23
Since 22/23, the fund has carried out two transitions. One, reallocating 5% of the portfolio from Global Equities (LCIV Newton and LCIV Sustainable Exclusion Equity Fund) to the Ninety-One Global Environment Fund. This was successful completed in March 2024. The other, moving 5% of assets from the LCIV Global Bond Fund (PIMCO) to LCIV MAC fund (PIMCO and CQS). This was completed in September 2023.
Fund Value
The Fund value fell during 2022/23 as a result of decreased value fixed income and property asset classes due to various geopolitical events. Between 2022/23 and 2023/24, the fund has had an upturn in value due to the strong performance in the equities.
The Fund is invested to meet liabilities over the medium to long-term and therefore its performance should be judged over a corresponding period. Annual returns can be volatile and do not necessarily indicate the underlying health of the Fund.
Investment Performance
The Fund’s overall performance in 2023/24 underperformed its benchmark for the year by 1.25%, as shown below. This was largely as a result of poor performance within the illiquid classes i.e. property. Benchmarks can be viewed in the Investment Strategy Statement.
Performance of the Fund is measured against an overall strategic benchmark. Below this, each fund manager is given individual performance targets which are linked to index returns for the assets they manage. Details of these targets can be found in the Investment Strategy Statement.
Performance of fund managers is reviewed quarterly by the Pension Fund Committee, which is supported by the Fund’s independent investment advisor, Redington.
The overall performance of each manager is measured over rolling three and five-year periods, as inevitably there will be short-term fluctuations in performance.
The graph below shows the performance of the various fund managers and their funds over 2023/24, compared to the benchmark returns:
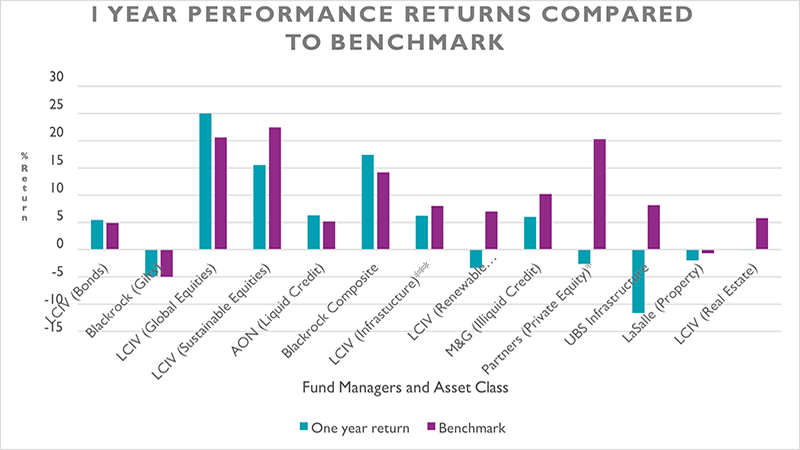
This data has been sourced from Northern Trust's performance reports. There is no annual data on LCIV MAC and Ninety- One Global Environment Fund as they transitioned under a year ago. LCIV Infrastructure and Renewable Infrastructure are still calling for capital and so may skew the results on this graph. Due to the nature of Private Equity, the measurement of performance data is also skewed.
If you require more detailed information about this graph, please contact pensions@bexley.gov.uk
The benchmark total return reflects what would be achieved by the market indices invested in the asset allocation recommended by the asset liability study. The relative return is the difference between the benchmark return and the actual return achieved but the Fund. All investments are seen through a long-term lens and should not be judged on the returns in any one year.
The graph below shows the performance of the Fund and its current investment managers over the 1, 3 and 5 year periods. The Fund has underperformed the benchmark over all three periods.
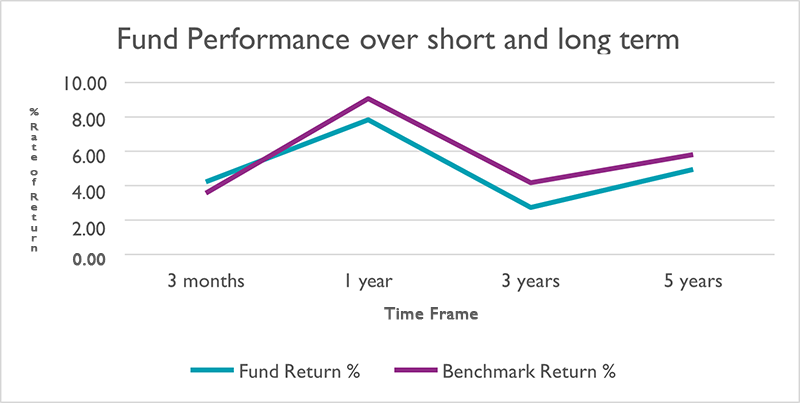
If you require more detailed information about this graph, please contact pensions@bexley.gov.uk
The portfolio is a mixture of active and passively managed asset classes:
- targets for active fund mandates are set to out-perform the benchmark by a set percentage through active stock selection and asset allocation
- targets for passive funds are set to achieve the benchmark through investment in a stable portfolio
Annually the Pensions and Investments Research Consultants (PIRC) compile a list of Local Authority pension performance analytics, ranking each Fund according to their performance in the 1-year to 30-year time periods. In the wider LGPS Universe, the average 1-year Fund return to 31 March 2024 was 9.2% compared to a 10-year average return of 7.6% p.a. As at 31 March 2024 the Universe comprised of 63 funds with a total value of £266bn.
The London Borough of Bexley Pension Fund placed in the lower quartile of fund returns for the 1- year period, this was largely due to the fund's relatively high commitment to bonds and low exposure to equities had a negative effect on relative performance this year.
Over the long term, the performance has done well, (placing 31 amongst the other funds). However, in more recent years, it has performed less optimally than its peers which can be contributed to the general defensive asset allocation than its peers. The defensive allocation has meant that the fund has prioritised low volatility.
In the 30-year period the Fund placed in the median quartile of pension fund performance. The table below shows the LGPS Universe average returns compared to the Fund over the 1-year to 30-year period, along with average LPGS returns by asset class over the same time periods.
| Performance | 1 year (% p.a.) | 3 years (% p.a.) | 5years (% p.a.) | 10 years (% p.a.) | 20 years (% p.a.) | 30 years (% p.a.) |
|---|---|---|---|---|---|---|
| Universe Average | 9.2 | 5.3 | 6.5 | 7.6 | 7.7 | 7.4 |
| London Borough of Bexley Pension Fund | 7.8 | 2.7 | 4.9 | 7.1 | 7.7 | 7.4 |
| Total Equity | 16.3 | 7.8 | 9.3 | 9.6 | 9.3 | 8.3 |
| London Borough of Bexley Pension Fund | 20.8 | 8.4 | 10.2 | 10.6 | 10.1 | 9 |
| Total Bonds | 4.4 | -2.5 | 0.1 | 2.9 | 4.5 | 5.5 |
| London Borough of Bexley Pension Fund | 0.7 | -5.8 | -2 | 0.2 | 3.2 | 4.7 |
| Infrastructure* | 2.7 | 8.9 | 6.7 | N/A | N/A | N/A |
| London Borough of Bexley Pension Fund | 0.3 | 7.2 | 4.2 | N/A | N/A | N/A |
| Property** | -3.2 | 1.7 | 1.4 | 5.3 | 5.2 | 6.8 |
| London Borough of Bexley Pension Fund | -1.6 | -0.5 | -0.2 | 4.5 | N/A | N/A |
This data has been extracted from the PIRC 2023/24 Local Authority Fund Statistics.
*Data only available for 5 years