
Census 2021

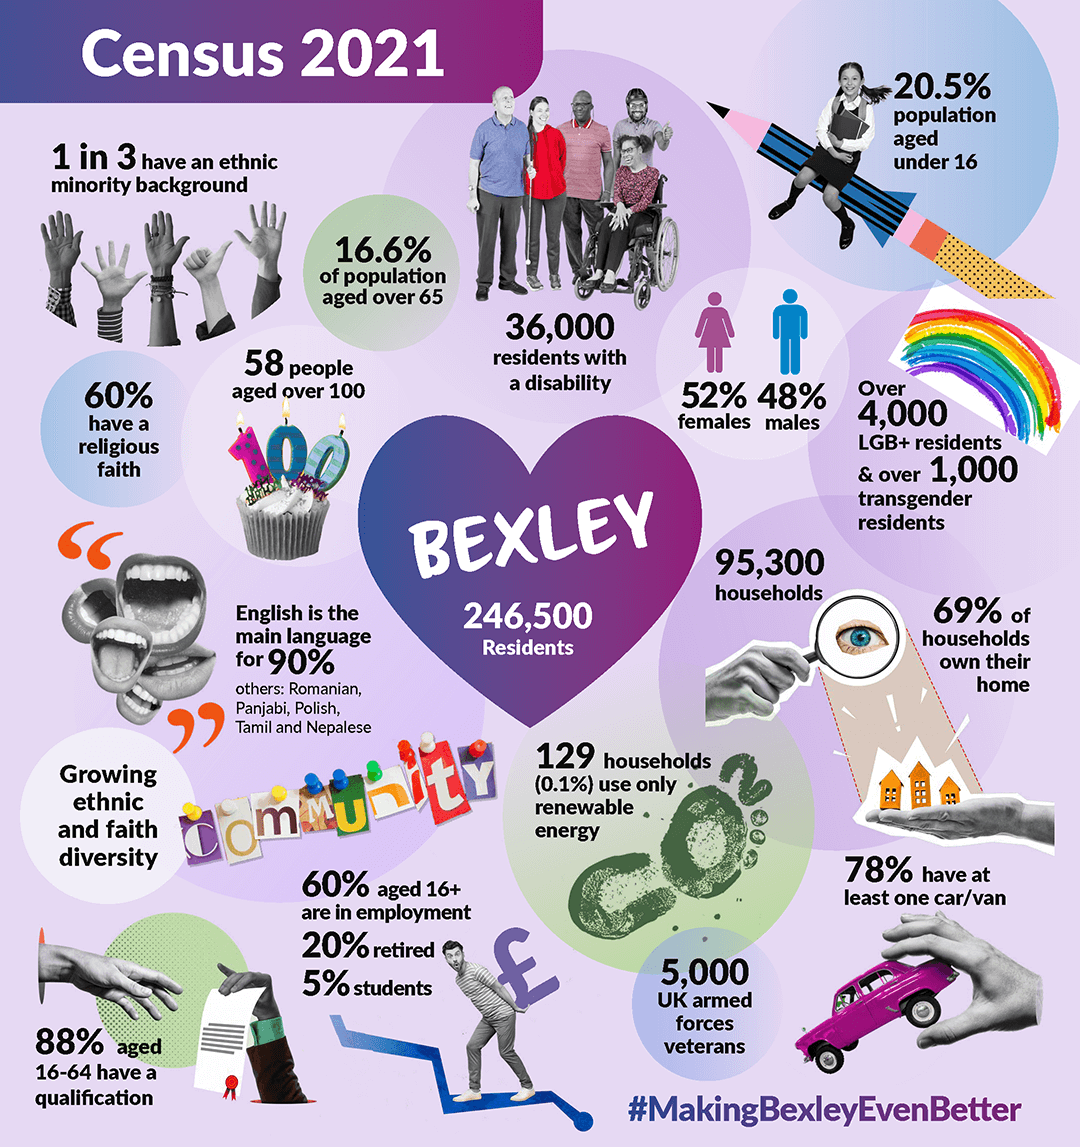
Infographic in words
- 246,500 population
- 52% females, 48% males
- 20.5% population aged under 16
- 16.6% of population aged over 65
- 58 people aged over 100
- 36,000 residents with a disability
- Over 4,000 LGB+ residents & over 1,000 transgender residents
- 5,000 UK armed forces veterans
- Growing ethnic and faith diversity
- 1 in 3 have an ethnic minority background
- 60% have a religious faith
- English is the main language for 90% (aged 3+). Other popular main languages are: Romanian, Panjabi, Polish, Tamil and Nepalese
- 88% aged 16 to 64 have a qualification
- 60% aged 16+ are in employment, 20% retired, 5% students
- 95,300 households
- 69% of households own their home
- 78% have at least one car/van
- 129 households (0.1%) use only renewable energy
A more detailed profile of Bexley can be found on the Office For National Statistics website, Census Area Profile.
About Bexley
- 246,472 people live in Bexley - this would fill the O2 arena more than 12 times
- we have lots of families (34% of our households have dependent children), a greater proportion than London, and England and Wales
- we have a high proportion of younger people (21% of our population is aged under 16), higher than London, and England and Wales
- we are becoming more ethnically diverse. 28% of our residents are from ethnic minority backgrounds. When we include residents from white ethnic minority backgrounds, this is 36%
- almost 7 out of 10 homes are owner-occupied (69%) which is the highest in London and higher than England and Wales
- our education levels are rising, with the percentage of our residents holding a qualification above A-levels rising from 22% in 2011 to 32% in 2021. Bexley is closing the gap to England and Wales but still much lower than London
- we’ve had growth in ‘professional’ jobs, which now make up 20% of all jobs in the borough, making it the largest occupation group
How has Bexley changed since the last census?
Bexley has grown in population and now has a greater mix of ethnic groups and faiths. The Office of National Statistics shows this Census area changes - Bexley.
About our neighbourhoods
Our neighbourhoods are diverse and fun, full of community and history:
- we have 17 wards in Bexley, with between 10,000 and 18,000 residents in each ward. Belvedere has the largest population, while Longlands has the lowest
- our wards in the north of the borough tend to have more younger residents, larger sized households and be more ethnically diverse. For example, in Erith, Thamesmead East, and Slade Green & Northend wards a quarter of their residents are aged under 16
- some of our wards are more economically disadvantaged, particularly Thamesmead East and Belvedere which have high proportions of residents unemployed and renting, with Belvedere having the greatest number of residents with no qualification
- select a ward area (top right in the box below) to view the population and household characteristics of that area
- view the second page (page arrows at the bottom of the box below) to see the same population and household characteristics for Bexley
Open in a new window (bottom right corner) to view as whole screen.