
Contents
- Executive Summary: Air Quality in Our Area
- Actions, Conclusions and Priorities to improve air quality
- Table A - Summary of National Air Quality and International Standards, Objectives and Guidelines
- Air Quality Monitoring
- Comparison of Monitoring Results with AQOs
- Action to Improve Air Quality
- Air Quality Action Plan Progress
- Planning Update and Other New Sources of Emissions
- Additional Activities to Improve air quality
- Appendix A - Details of Monitoring Site Quality QA/QC
- Appendix B - Summary of Breathe London Sensor Monitoring Data
- Appendix C - Map(s) of Monitoring Locations and AQMAs
- Appendix D - Abbreviations
Comparison of Monitoring Results with AQOs
Table C. Annual Mean NO2 Monitoring Results: Automatic Monitoring (µg m-3)
| Site ID | X OS Grid Ref (Easting) | Y OS Grid Ref (Northing) | Site Type | Valid data capture for monitoring period %(a) | Valid data capture 2025 %(b) | 2019 | 2020 | 2021 | 2022 | 2023 | 2024 | 2025 |
|---|---|---|---|---|---|---|---|---|---|---|---|---|
| BX1 | 551854 | 176380 | Urban Background | 81.1 | 81.1 | 22 | 18 | 19 | 18 | 16 | 15 | 16.4 |
| BX2 | 549999 | 179090 | Urban Background | 95 | 95 | 23 | 18 | 16 | 16 | 15 | 15 | 15.6 |
| BQ7 | 548465 | 179469 | Urban Background | 85.1 | 85 | 21 | 17 | 17 | 16 | 14 | 13 | 14.6 |
| GB6 | 544999 | 175098 | Kerbside | 98.5 | 98.5 | 36 | 27 | 27 | 22 | 17.3 (annualised) | 17 | 19.9 |
Notes
The annual mean concentrations are presented as μg m-3.
Exceedances of the NO2 annual mean AQO of 40 μg m-3 are shown in bold.
NO2 annual means in excess of 60 μg m-3, indicating a potential exceedance of the NO2 hourly mean AQS objective are shown in bold and underlined.
Means for diffusion tubes have been corrected for bias.
All means have been “annualised” in accordance with LLAQM Technical Guidance if valid data capture for the calendar year is less than 75% and greater than 25%.
Concentrations are those at the location of monitoring and not those following any fall-off with distance adjustment.
(a) Data capture for the monitoring period, in cases where monitoring was only carried out for part of the year.
(b) Data capture for the full calendar year (e.g. if monitoring was carried out for six months the maximum data capture for the full calendar year would be 50%).
Figure A: Trends in Annual Mean NO2 Concentrations
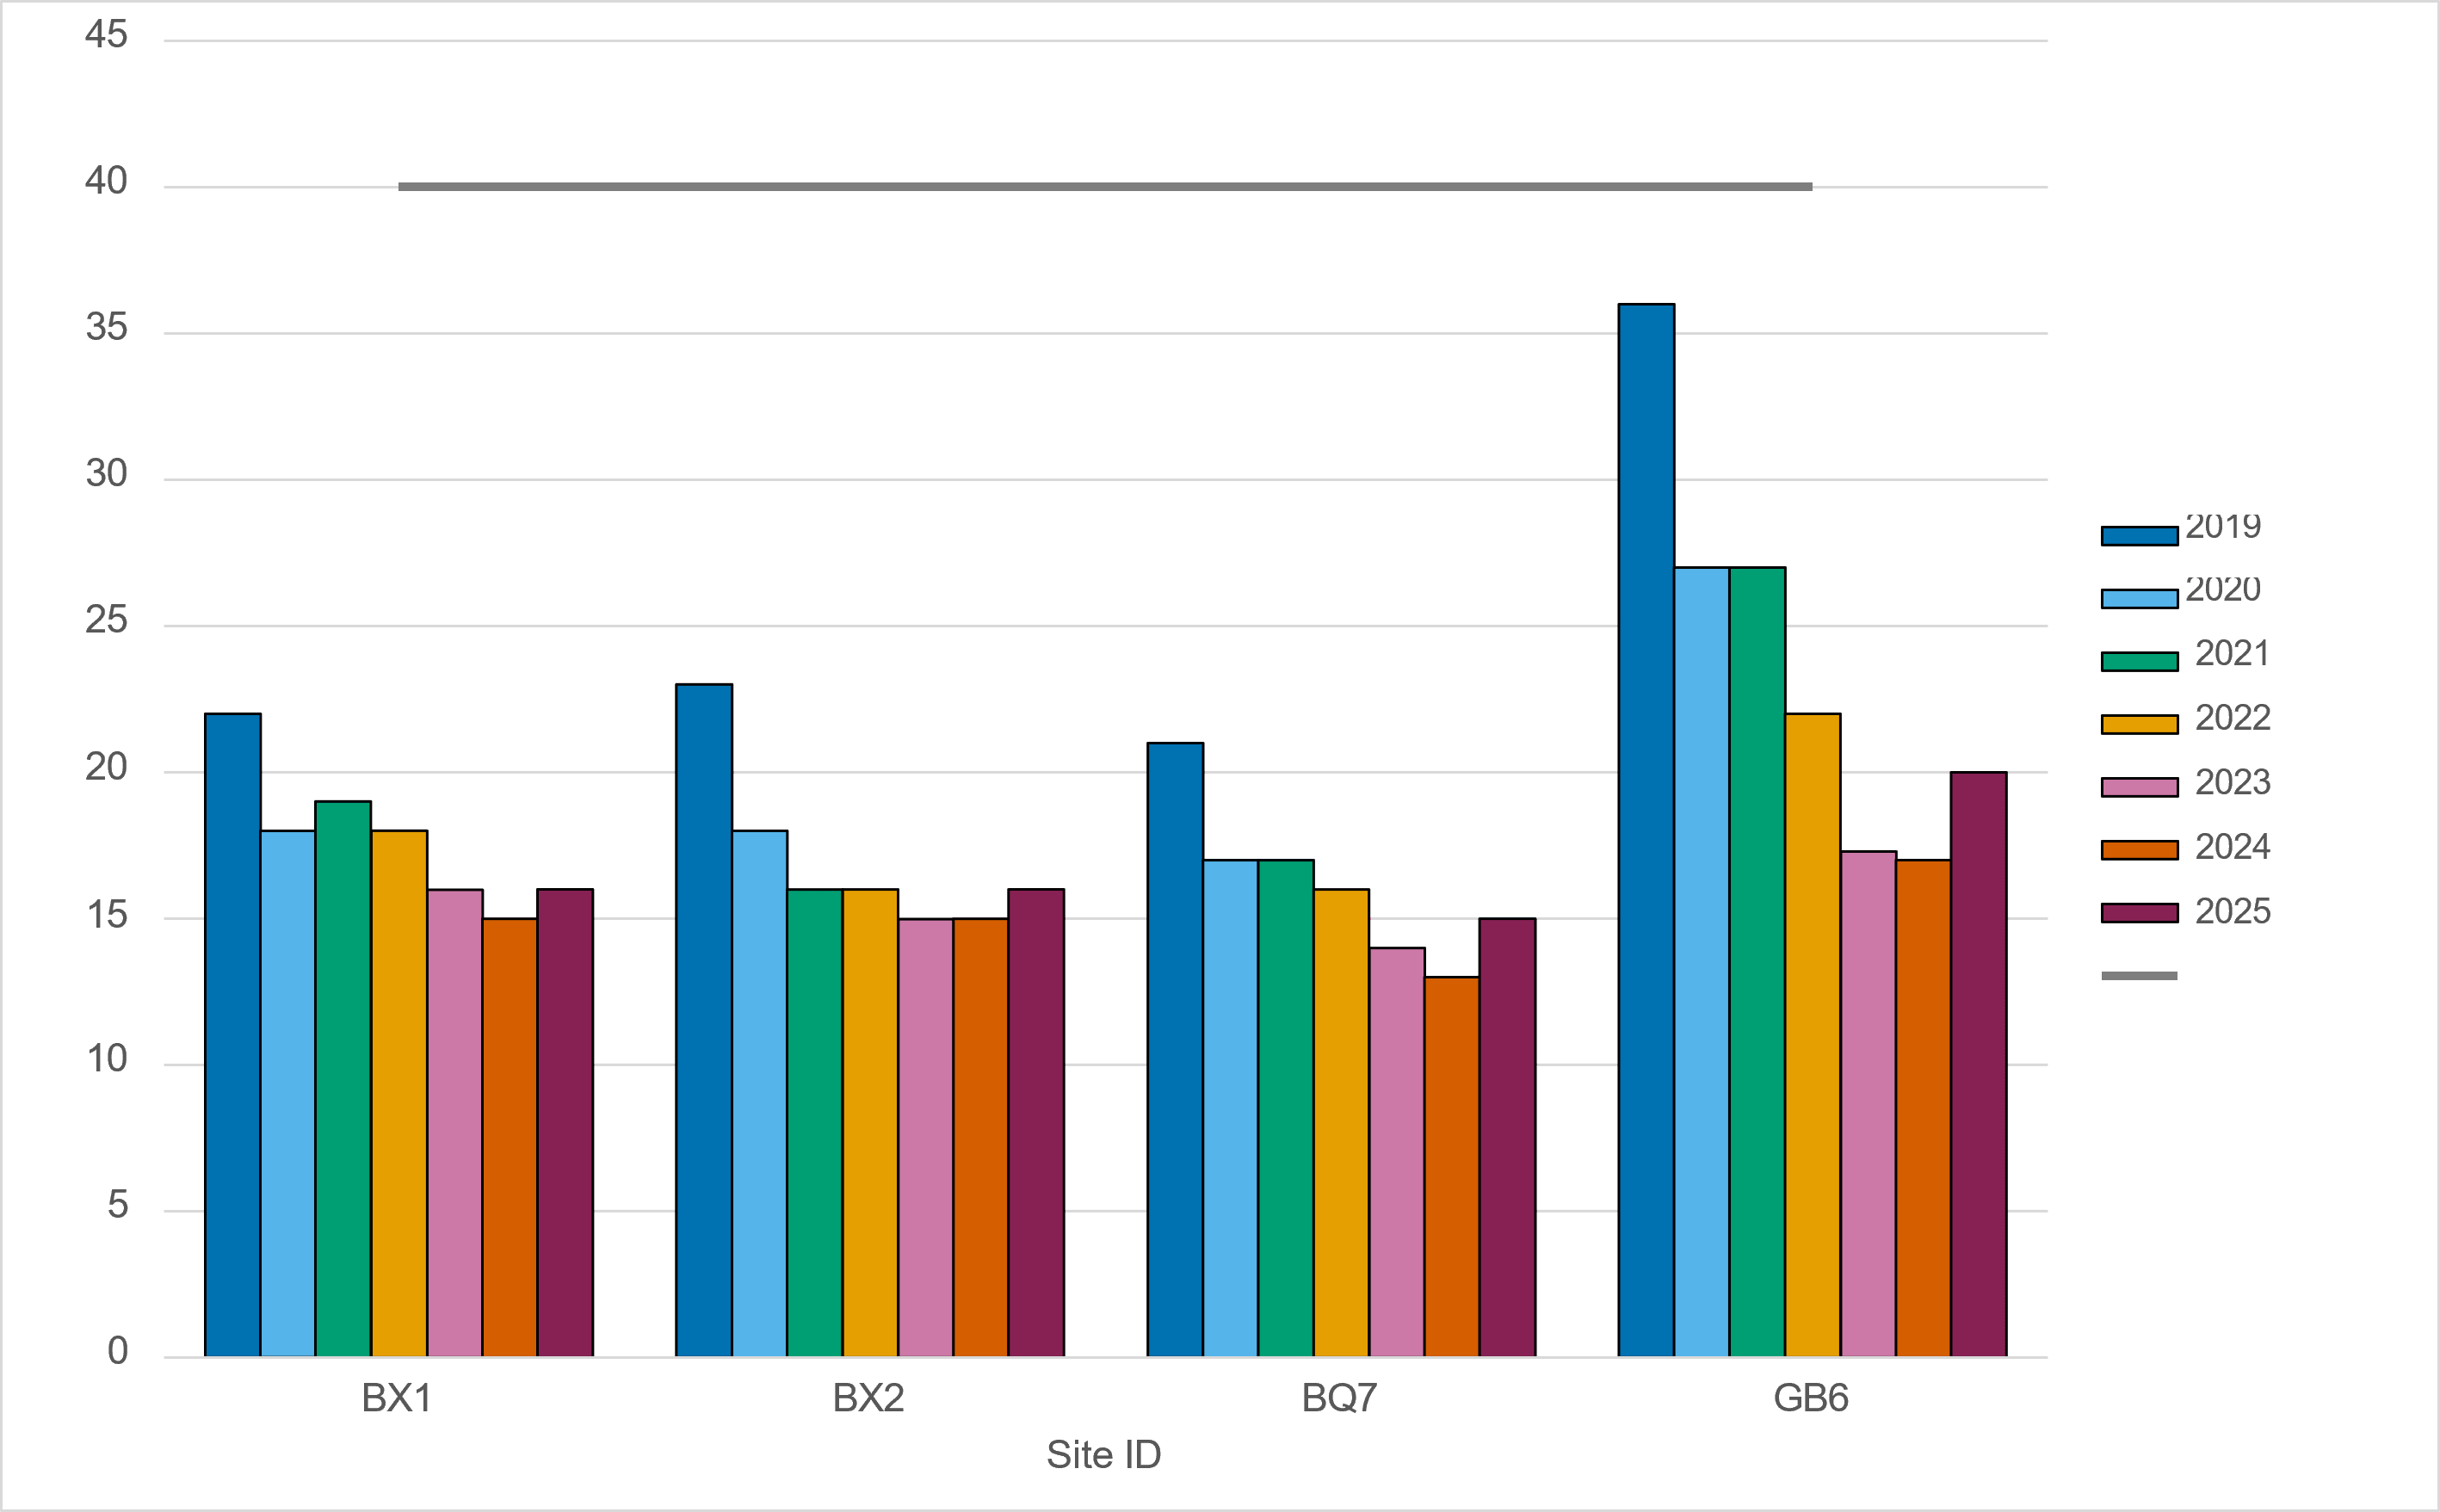
Image description: Bar chart showing annual mean nitrogen dioxide (NO₂) concentrations (µg/m³) at four monitoring sites (BX1, BX2, BQ7 and GB6) from 2019 to 2025, with a target value of 40 µg/m³ indicated by a horizontal line. All recorded concentrations are below the target throughout the period. GB6 recorded the highest concentrations in every year, decreasing from 36 µg/m³ in 2019 to 20 µg/m³ in 2025. BX1 decreased from 22 µg/m³ to 16 µg/m³, BX2 from 23 µg/m³ to 16 µg/m³, and BQ7 from 21 µg/m³ to 15 µg/m³ over the same period. Concentrations generally declined across all sites between 2019 and 2024, with small increases at some sites in 2025. Overall, the chart demonstrates a downward trend in annual mean NO₂ concentrations and continued compliance with the 40 µg/m³ target at all monitoring locations. (Chart: Combo)
Figure B: Trends in Annual Mean NO2 Concentrations at Roadside and Background sites in Bexley 2000 to 2025
Figure B Trends in Annual Mean NO2 Concentrations at Roadside and Background sites in Bexley 2000 to 2025. Background concentrations are the average of background sites in Bexley (BX1, BX2, and BQ7)
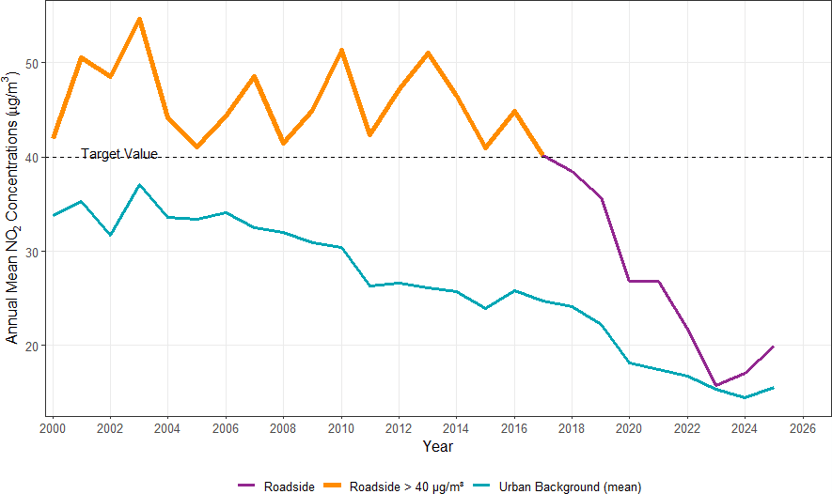
Image description: Line graph showing annual mean NO₂ concentrations (µg/m³) from 2000 to 2025 for roadside locations, roadside locations exceeding 40 µg/m³, and urban background levels. Roadside concentrations fluctuate above target value until 2018, then sharply decline below target, while urban background levels steadily decrease throughout, with a slight rise projected after 2023.
Table F and Figures A demonstrate continued compliance with both the annual mean and 1-hour mean NO2 air quality objectives across the monitoring network. No exceedances were recorded at any monitoring site in 2025. Annual mean NO2 concentrations ranged from 15 µg/m³ at BQ7(Urban Background) to 20 µg/m³ at GB6 (Roadside), with all sites remaining well below the annual mean objective of 40 µg/m³.
Although a small increase in annual mean NO2 concentrations was observed at all sites in 2025 compared with 2024, concentrations remain substantially below objective levels and significantly lower than those recorded historically, indicating sustained improvements in air quality across the borough. The roadside site, GB6, continued to record the highest concentrations (20 µg/m³), while BQ7 recorded the lowest (15 µg/m³), indicating that NO2 concentrations are now relatively consistent across both roadside and urban background environments within the borough.
The long-term trend demonstrates a significant reduction in NO2 concentrations across both roadside and urban background locations since the early 2000s in the Figure B Roadside concentrations have fallen from levels above 40 µg/m³ in the early part of the monitoring record to around 20 µg/m³ in 2025, while urban background concentrations have reduced from approximately 34 µg/m³ to 15 µg/m³ over the same period.
The gap between roadside and background concentrations has continued to narrow, confirming that the reduction in concentrations is a direct result of lower road vehicle emissions of oxides of nitrogen (NOx). These improvements are likely to reflect cleaner vehicle technologies and transport emission reduction measures with tighter emission standards implemented across London.
Table D. NO2 Automatic Monitoring Results
| Site ID | X OS Grid Ref (Easting) | Y OS Grid Ref (Northing) | Site Type | Valid data capture for monitoring period %(a) | Valid data capture 2025 %(b) | 2019 | 2020 | 2021 | 2022 | 2023 | 2024 | 2025 |
|---|---|---|---|---|---|---|---|---|---|---|---|---|
| BX1 | 551854 | 176380 | Urban Background | 81.1 | 81.1 | 0 | 0 | 0 | 0 | 0 | 0 | 0 (80) |
| BX2 | 549999 | 179090 | Urban Background | 95 | 95 | 0 | 0 | 0 | 0 | 0 | 0 | 0 |
| BQ7 | 548465 | 179469 | Urban Background | 85.1 | 85 | 0 | 0 | 0 | 0 | 0 | 0 | 0 (77) |
| GB6 | 544999 | 175098 | Kerbside | 98.5 | 98.5 | 0 | 0 | 0 | 0 | 0 (99.8th percentile 65.8 μgm-3) | 0 | 0 |
Notes
Results are presented as the number of 1-hour periods where concentrations greater than 200 μg m-3 have been recorded. Exceedance of the NO2 short term AQO of 200 μg m-3 over the permitted 18 hours per year are shown in bold.
If the period of valid data is less than 85%, the 99.8th percentile of 1-hour means is provided in brackets.
(a) Data capture for the monitoring period, in cases where monitoring was only carried out for part of the year
(b) Data capture for the full calendar year (e.g. if monitoring was carried out for six months the maximum data capture for the full calendar year would be 50%)
Table F shows that all automatic monitoring sites achieved compliance with the NO2 1-hour mean air quality objective in 2025. No hourly concentrations above 200 µg/m³ were recorded at any site during the year resulting no exceedances of the 1-hour mean air quality objective.
Table E. Annual Mean PM10 Automatic Monitoring Results (μg m-3)
| Site ID | X OS Grid Ref (Easting) | Y OS Grid Ref (Northing) | Site Type | Valid data capture for monitoring period %(a) | Valid data capture 2025 %(b) | 2019 | 2020 | 2021 | 2022 | 2023 | 2024 | 2025 |
|---|---|---|---|---|---|---|---|---|---|---|---|---|
| BX1 | 551854 | 176380 | Urban Background | 96.3 | 96.3 | 17 | 13 | 14 | 15 | 14 | 12 | 15.3 |
| BX2 | 549999 | 179090 | Urban Background | 98.2 | 98.2 | 19 | 18 | 18 | 14 (annualised) | 13 | 12 | 15.7 |
| BQ7 | 548465 | 179469 | Urban Background | 99.6 | 99.6 | 18 | 18 | 17 | 13 (annualised) | 11 | 11 | 14 |
| GB6 | 544999 | 175098 | Kerbside | 96.1 | 96.1 | 19 | 18 | 19 | 17 | 15.8 (annualised) | 16 | 18.7 |
Notes
The annual mean concentrations are presented as μg m-3.
Exceedances of the PM10 annual mean AQO of 40 μg m-3 are shown in bold.
All means have been “annualised” in accordance with LLAQM Technical Guidance, if valid data capture is less than 75% and more than 25%.
(a) Data capture for the monitoring period, in cases where monitoring was only carried out for part of the year.
(b) Data capture for the full calendar year (e.g. if monitoring was carried out for six months the maximum data capture for the full calendar year would be 50%).
Figure C: Trends in Annual Mean PM10 Concentrations
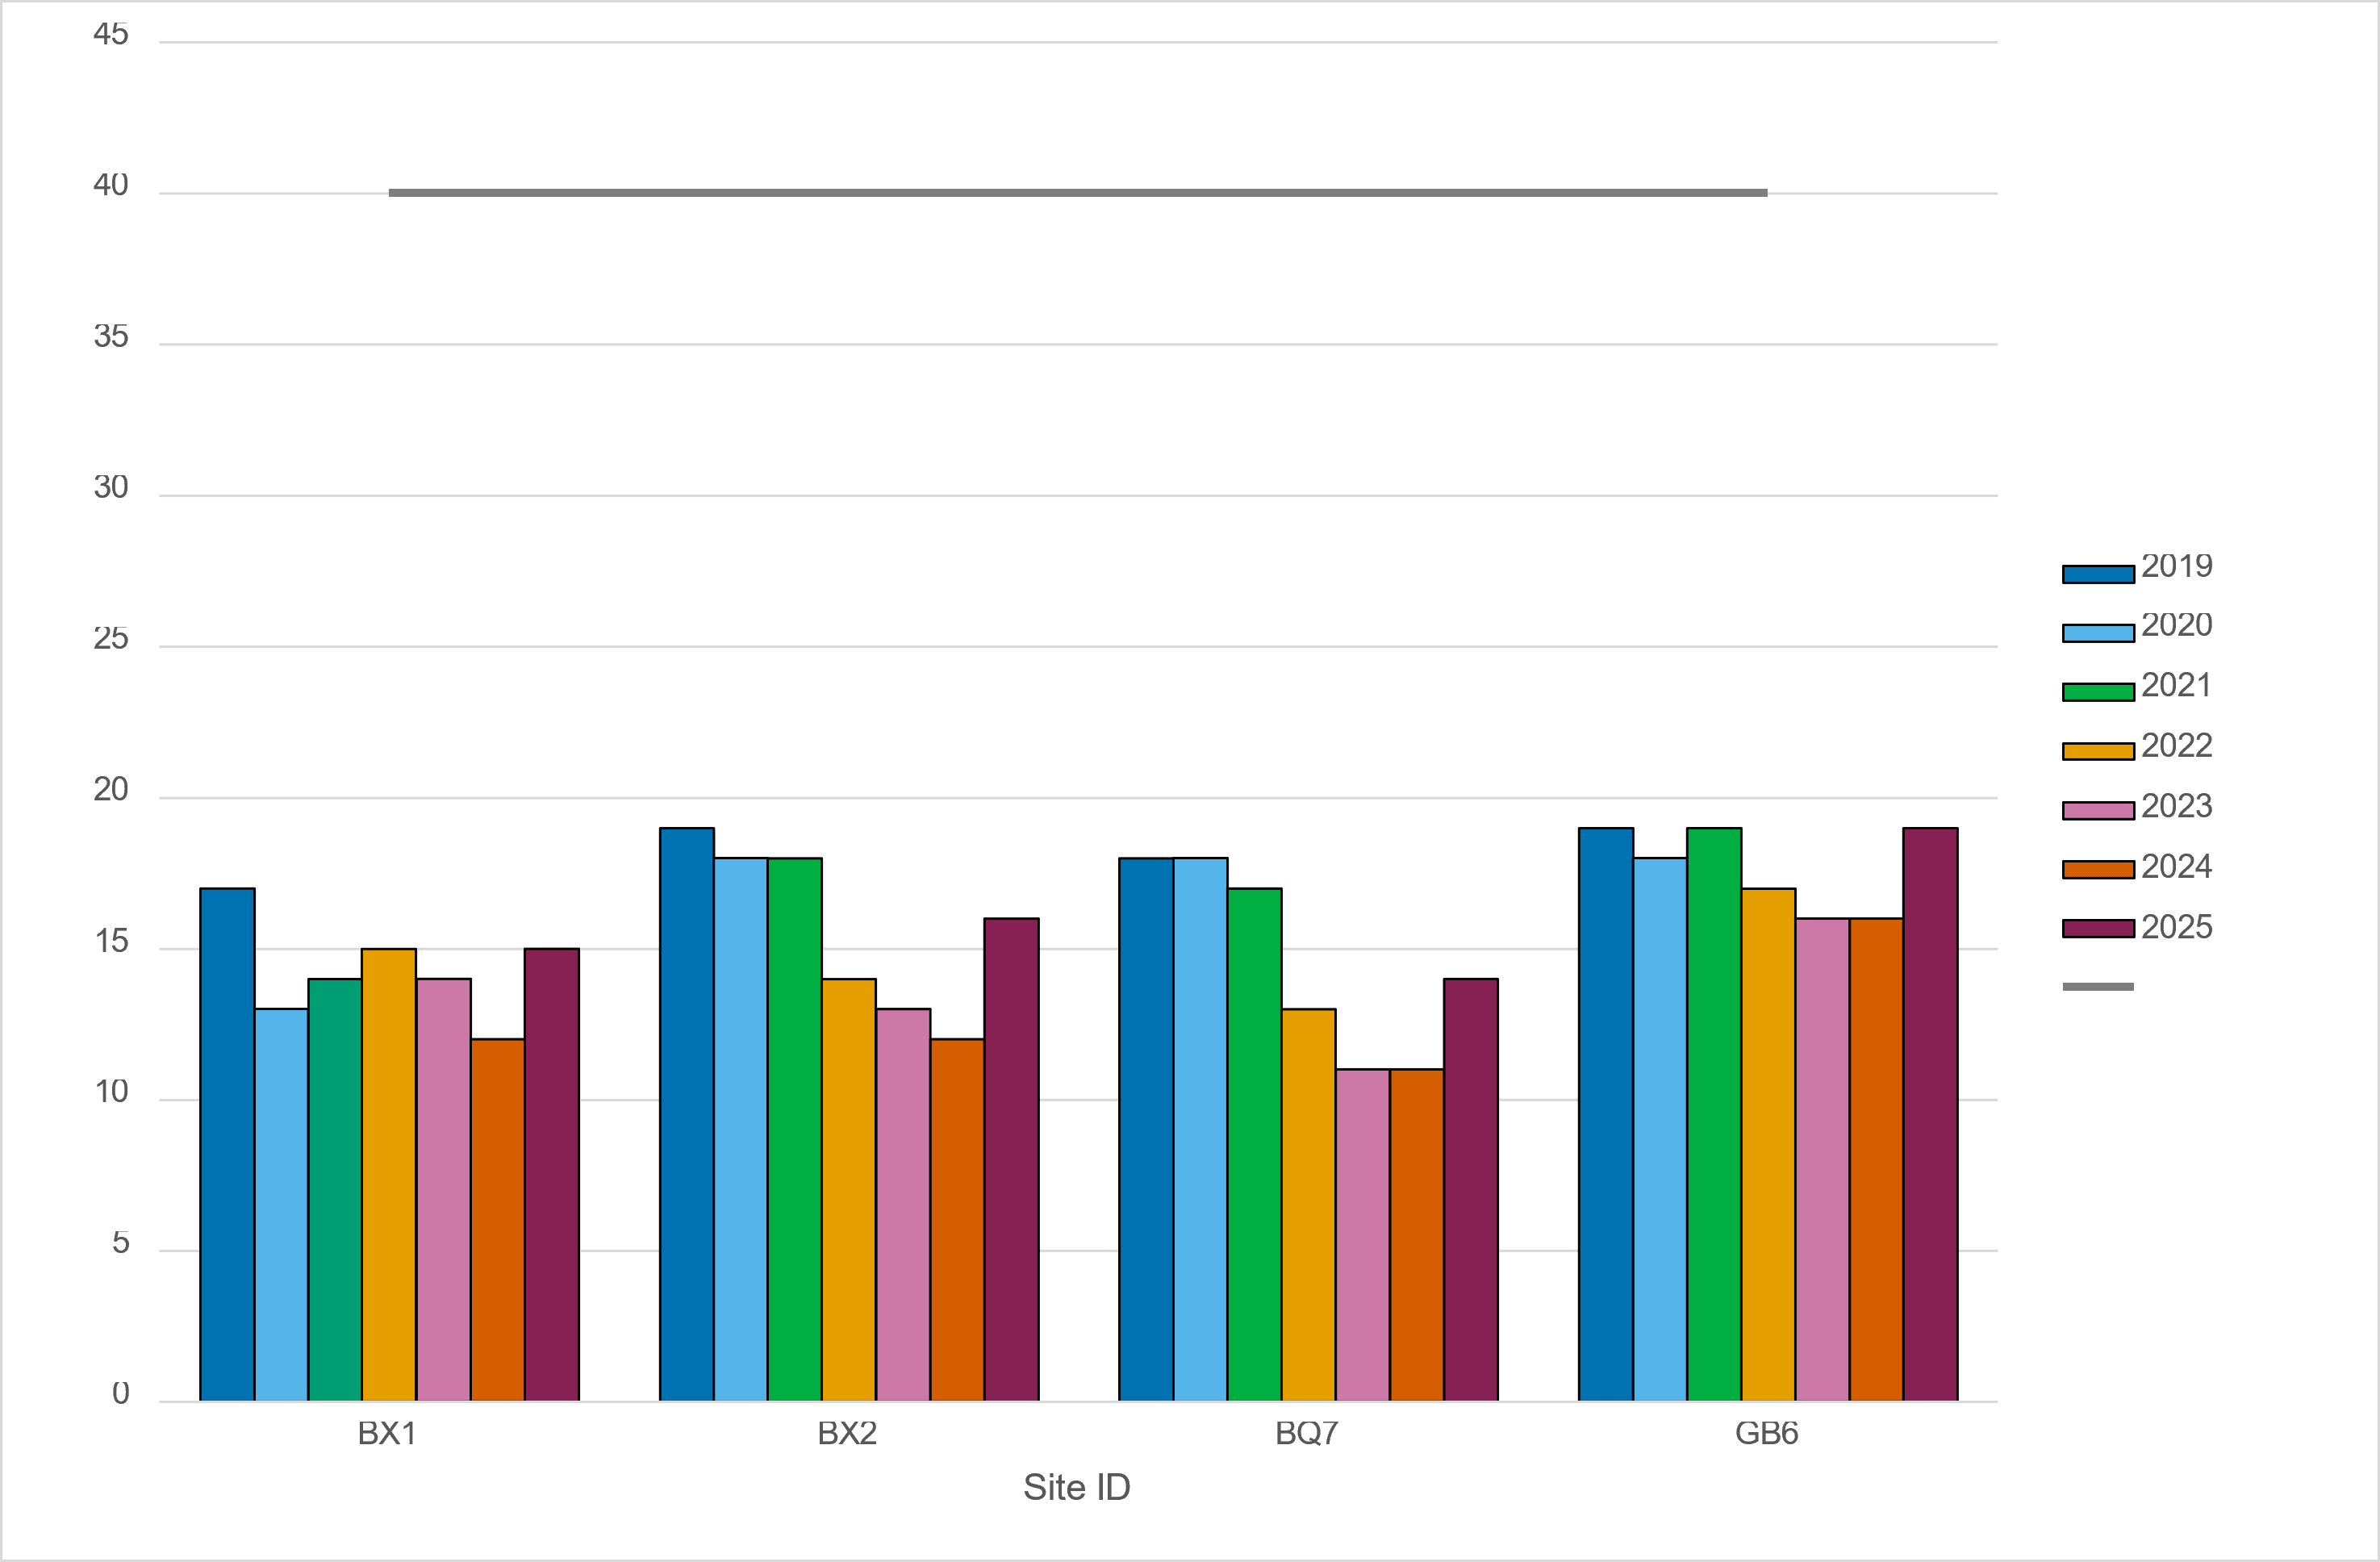
Image description: The figure shows bar plots of annual mean PM₁₀ concentrations across the four monitoring sites: BX1, BX2, BQ7, and GB6. All recorded concentrations are below the annual mean objective of 40 µg/m³. (Chart: Combo)
Figure D: Trends in Annual Mean PM10 Concentrations
Figure D Trends in Annual Mean PM10 Concentrations. Background concentrations are the average of background sites in Bexley (BX1, BX2, and BQ7).
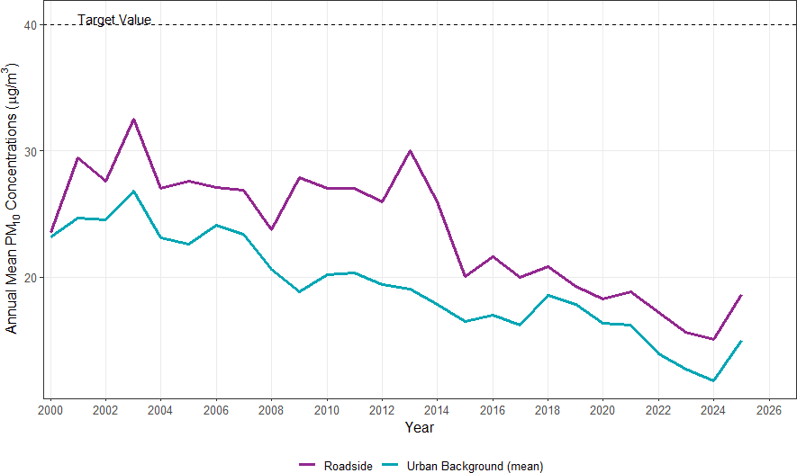
Image description: Line graph showing annual mean PM10 concentrations from 2000 to 2025 for roadside and urban background locations, with a target value marked at 40 µg/m³. Roadside concentrations consistently exceed urban background levels, both showing a declining trend, with a notable drop after 2014 and slight increases near 2024.Concentrations have remained below the annual mean objective of 40 µg/m³ throughout the period from 2000 to 2025. Background sites included: BX1, BX2, and BQ7. Roadside site is GB6.
Table G and Figures C present annual mean PM10 concentrations recorded at the four automatic monitoring sites at Bexley, between 2019 and 2025. All monitoring locations remained well below the annual mean Air Quality Strategy (AQS) objective of 40 µg/m³ throughout the reporting period. In 2025, annual mean concentrations ranged from 14 µg/m³ at BQ7 to 19 µg/m³ at GB6, the lowest concentration and the highest concentration sites respectively. Despite GB6 being a roadside monitoring location, concentrations were only marginally higher than those recorded at the urban background sites, indicating relatively small spatial variation in PM10 concentrations across the borough. All annual mean concentrations remained substantially below the annual mean objective of 40 µg/m³.
The long-term trend in the Figure D, indicates a substantial reduction in PM10 concentrations over the last 25 years at both roadside and urban background locations. This improvement is likely to reflect a combination of cleaner vehicle technologies and transport emission control measures implemented across London which has accelerated the uptake of lower-emission vehicles.
Table F. PM10 Automatic Monitoring Results: Comparison with 24-Hour Mean Objective, Number of PM10 24-Hour Means > 50 μg m-3
| Site ID | X OS Grid Ref (Easting) | Y OS Grid Ref (Northing) | Site Type | Valid data capture for monitoring period %(a) | Valid data capture 2025 %(b) | 2019 | 2020 | 2021 | 2022 | 2023 | 2024 | 2025 |
|---|---|---|---|---|---|---|---|---|---|---|---|---|
| BX1 | 551854 | 176380 | Urban Background | 96.3 | 96.3 | 8 | 1 | 1 | 5 | 0 | 0 | 7 |
| BX2 | 549999 | 179090 | Urban Background | 98.2 | 98.2 | 11 | 7 | 3 | 0 | 0 | 0 | 6 |
| BQ7 | 548465 | 179469 | Urban Background | 99.6 | 99.6 | 4 | 3 | 1 | 0 | 0 | 0 | 1 |
Notes
Exceedances of the PM10 24-hour mean objective (50 μg m-3 over the permitted 35 days per year) are shown in bold.
Where the period of valid data is less than 85% of a full year, the 90.4th percentile is provided in brackets.
(a) data capture for the monitoring period, in cases where monitoring was only carried out for part of the year
(b) data capture for the full calendar year (e.g. if monitoring was carried out for six months the maximum data capture for the full calendar year would be 50%).
Figure E: Trends in Number of 24-Hour Mean PM10 Results > 50µg/m3
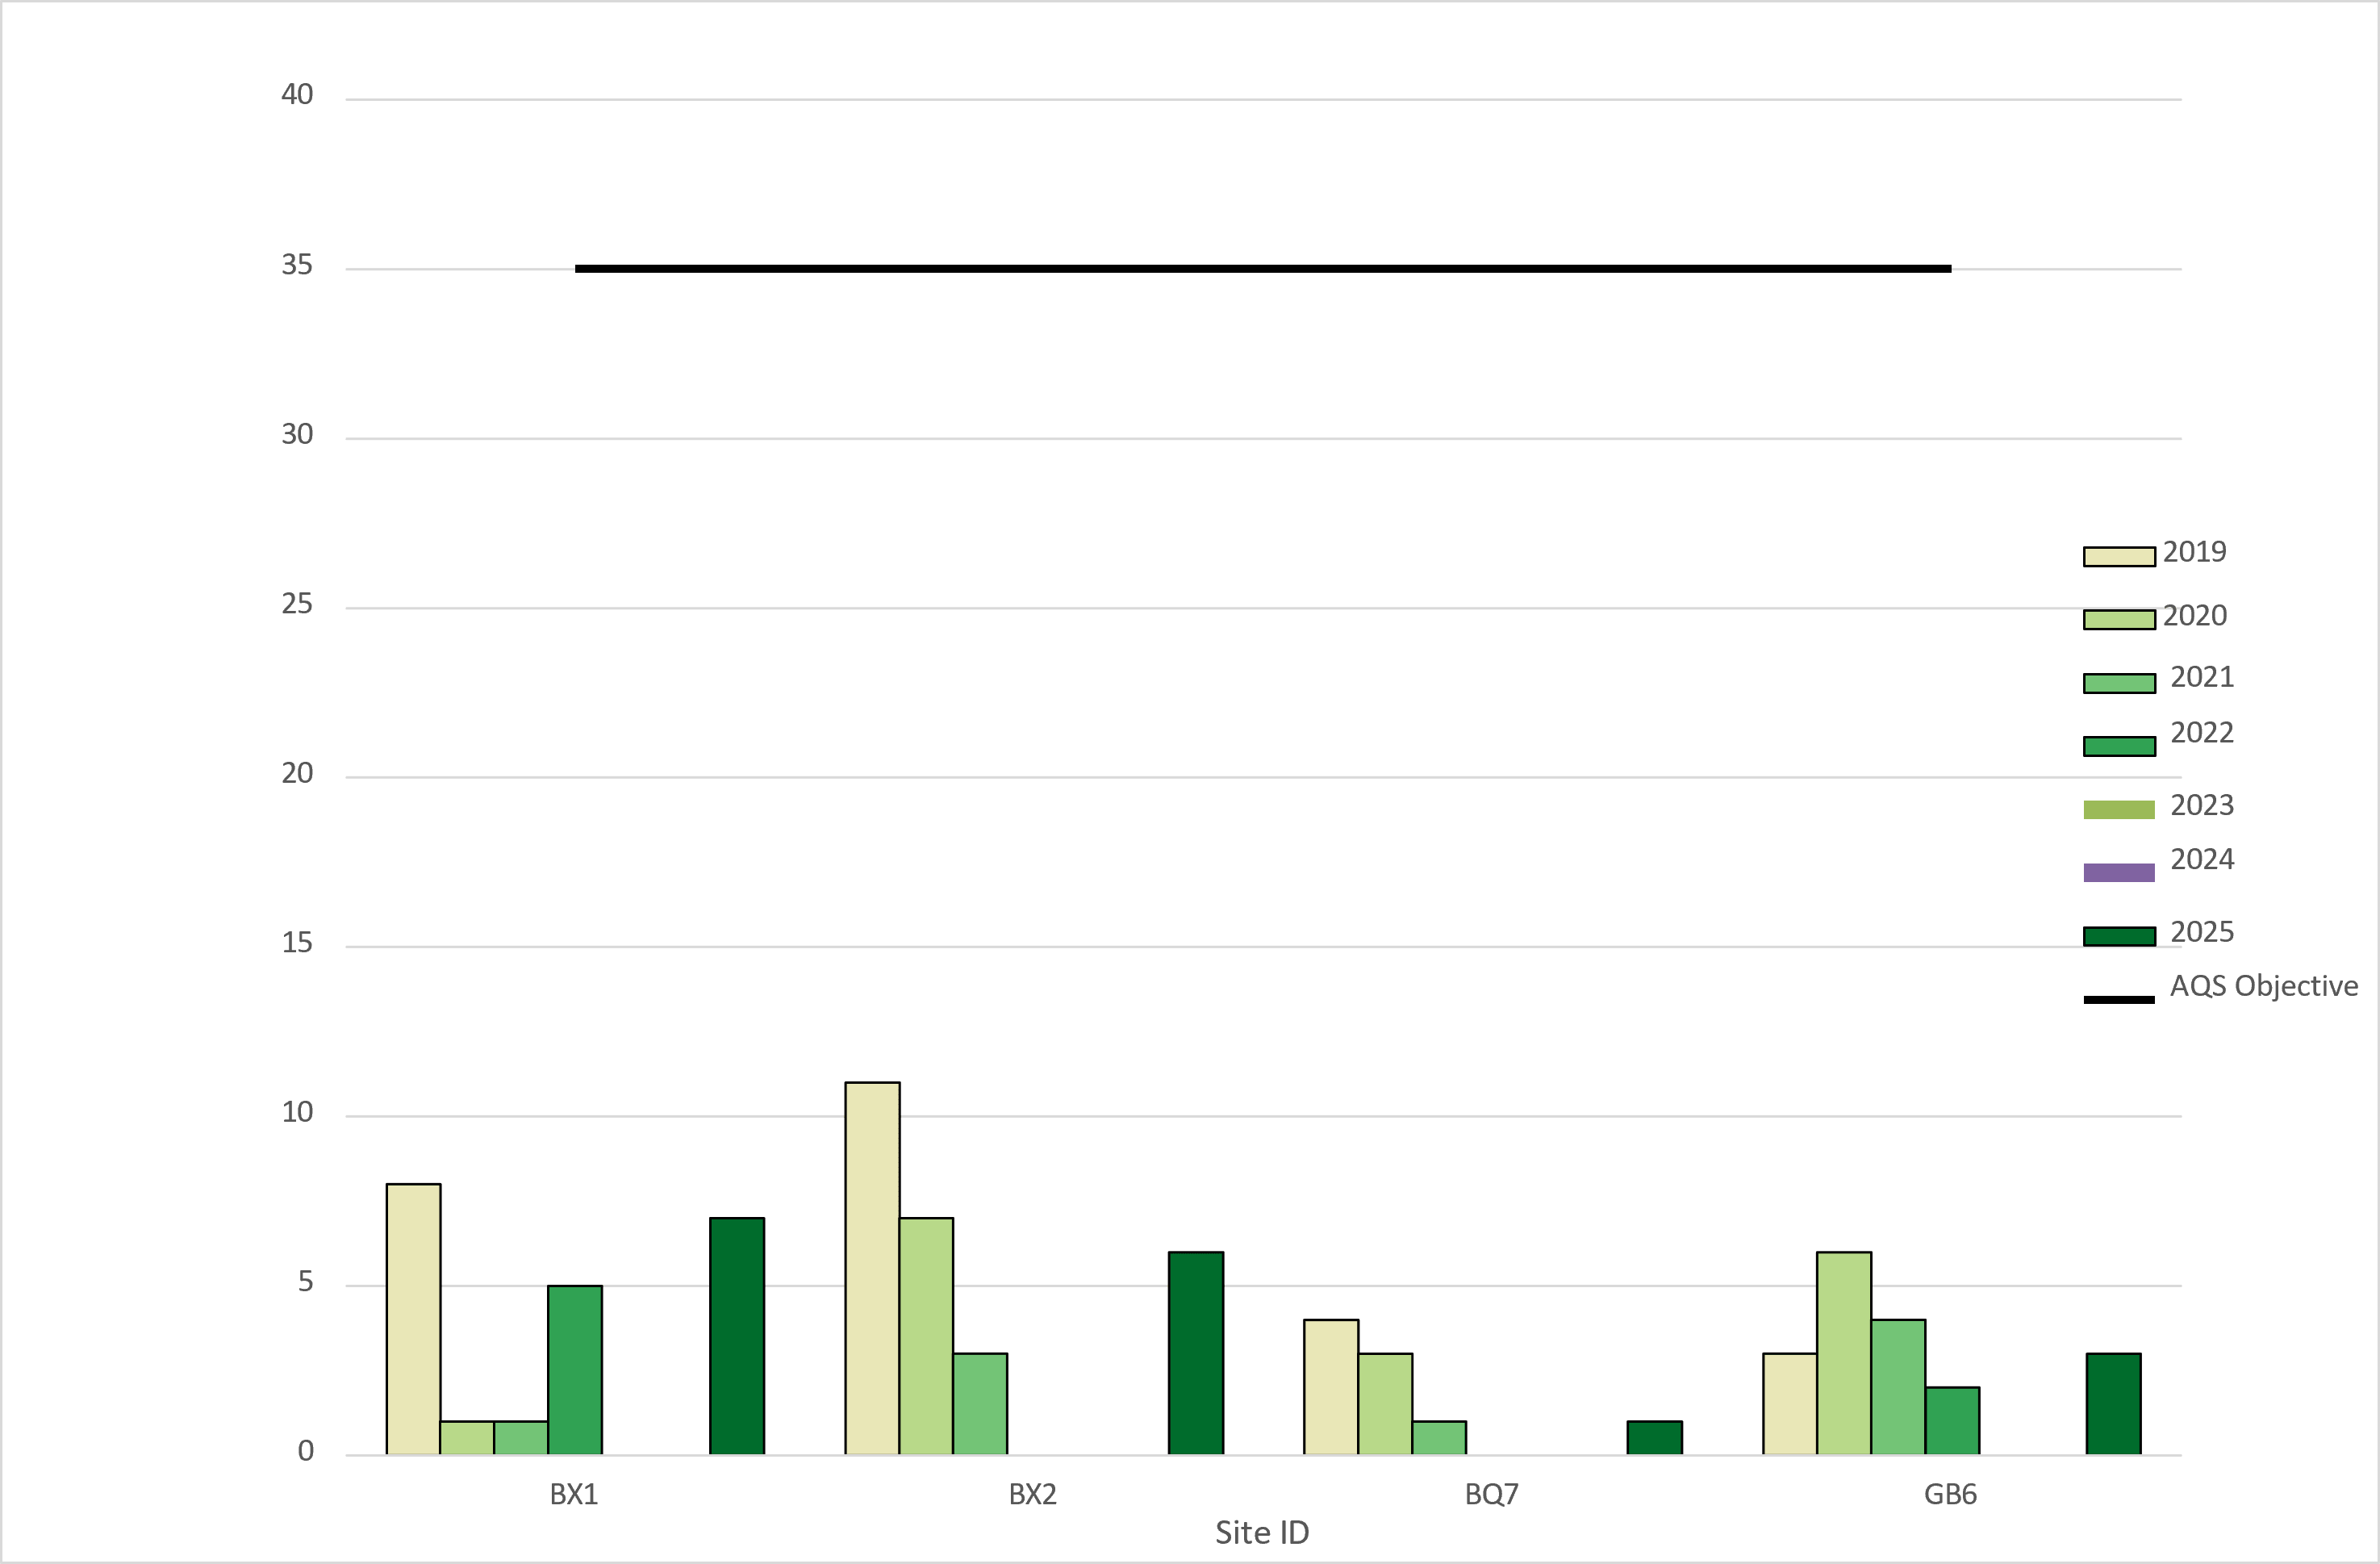
Image description: The figure shows the annual number of exceedances of the PM₁₀ daily mean concentration threshold of 50 µg/m³. All sites recorded fewer than 35 exceedances in each reporting year and therefore complied with the AQS objective. (Chart: Combo)
The Table H and Figure H shows number of daily means PM10 exceedances above 50 µg/m³ also remained well within the permitted limit of 35 days per year at all sites. In 2025, exceedances ranged from 1 day at BQ7 to 7 days at BX1, demonstrating continued compliance with the 24-hour mean objective. Although exceedance counts increased slightly compared with 2024, levels remain low and are generally below those recorded in 2019 and 2020. This may be due to random short-term PM10 pollution events and currently there is no evidence of risk of exceedance of 24 hour objective at any monitoring locations at London Borough of Bexley.
Table G. Annual Mean PM2.5 Automatic Monitoring Results (μg m-3)
| Site ID | X OS Grid Ref (Easting) | Y OS Grid Ref (Northing) | Site Type | Valid data capture for monitoring period %(a) | Valid data capture 2025 %(b) | 2019 | 2020 | 2021 | 2022 | 2023 | 2024 | 2025 |
|---|---|---|---|---|---|---|---|---|---|---|---|---|
| BX1 | 551854 | 176380 | Urban Background | 98.5 | 98.5 | 12 | 9 | 9 | 9 | 8 | 7.8 | 9.7 |
| BX2 | 549999 | 179090 | Urban Background | 98.2 | 98.2 | - | - | - | 8 (annualised) | 8 | 7.3 | 9.3 |
| BQ7 | 548465 | 179469 | Urban Background | 99.6 | 99.6 | - | - | - | 8 (annualised) | 7 | (7) 6.8 (annualised) | 8.9 |
| GB6 | 544999 | 175098 | Kerbside | 94.6 | 94.6 | - | - | - | 9 (annualised) | 9 (annualised) | (9) 8.9 (annualised) | 9.8 |
Notes
The annual mean concentrations are presented as μg m-3.
Exceedances of the PM2.5 annual mean concentration target of 10 μg m-3 which needs to be achieved by 2040 are shown in bold. All means have been “annualised” in accordance with LLAQM Technical Guidance, if valid data capture is less than 75% and more than 25%.
(a) Data capture for the monitoring period, in cases where monitoring was only carried out for part of the year.
(b) Data capture for the full calendar year (e.g. if monitoring was carried out for six months the maximum data capture for the full calendar year would be 50%).
Figure F Trends in Annual Mean PM2.5 Concentrations
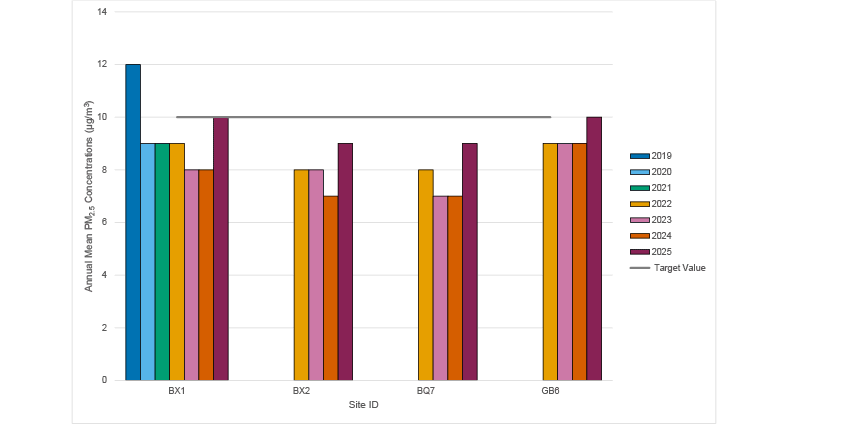
Image description: Bar chart showing annual mean PM₂.₅ concentrations (µg/m³) at four monitoring sites (BX1, BX2, BQ7 and GB6) between 2019 and 2025, compared with a target value of 10 µg/m³ shown as a horizontal line.
All recorded concentrations are at or below the target value, except BX1 in 2019, which measured 12 µg/m³. At BX1, concentrations decreased from 12 µg/m³ in 2019 to 8 µg/m³ in 2023 and 2024, before increasing to 10 µg/m³ in 2025. Data for BX2, BQ7 and GB6 are available from 2022 onwards. BX2 recorded 8 µg/m³ in 2022 and 2023, 7 µg/m³ in 2024, and 9 µg/m³ in 2025. BQ7 recorded 8 µg/m³ in 2022, 7 µg/m³ in 2023 and 2024, and 9 µg/m³ in 2025. GB6 recorded 9 µg/m³ from 2022 to 2024 and 10 µg/m³ in 2025.
Overall, PM₂.₅ concentrations remained low across all sites and years, with all locations meeting the 10 µg/m³ target from 2020 onwards. (Chart: Combo).
Table I and Figure I present annual mean PM2.5 concentrations measured at the four automatic monitoring stations between 2019 and 2025. All sites recorded concentrations at or below the PM2.5 annual mean objective of 10 µg/m³ which required to be achieved by 2040. In 2025, annual mean concentrations ranged from 8.9 µg/m³ at BQ7 to 9.8 µg/m³ at GB6. Although GB6 is a kerbside site, concentrations were only slightly higher than at the urban background locations, indicating relatively little variation across the monitoring network.
Overall, the results demonstrate a gradual improvement in PM2.5 air quality across the borough over recent years, with all monitored locations meeting the annual mean objective in 2025. The difference between lowest concentration at BQ7 (8.9 µg/m³) and the highest at GB6 (9.8 µg/m³), was less than 1 µg/m³, reflecting generally uniform PM2.5 concentrations across both background and roadside environments.
Table H. 2025 SO2 Automatic Monitoring Results: Comparison with Objectives
| Site ID | Valid data capture for monitoring period %(a) | Valid data capture 2025 %(b) | Number of 15-minute means > 266 μg m-3 | Number of 1-hour mean > 350 μg m-3 | Number 24-hour mean > 125 μg m-3 |
|---|---|---|---|---|---|
| BX1 | 76 | 76 | 0 | 0 | 0 |
Notes
Results are presented as the number of instances where monitored concentrations are greater than the objective concentration.
Exceedances of the SO2 objectives are shown in bold (15-min mean = 35 allowed a year, 1-hour mean = 24 allowed a year, 24-hour mean = 3 allowed a year).
If the period of valid data is less than 85%, the relevant percentiles are provided in brackets.
(a) Data capture for the monitoring period, in cases where monitoring was only carried out for part of the year.
(b) Data capture for the full calendar year (e.g. if monitoring was carried out for six months the maximum data capture for the full calendar year would be 50%).
Table I. Other Pollutants-2025 O3 Automatic Monitoring Results: Comparison with Objectives
| Site ID | Valid data capture for monitoring period %(a) | Valid data capture 2025 %(b) | 2025 |
|---|---|---|---|
| BX1 Slade Green | 94 | 94 | 10 days>100 µg/m3 |
| BQ7 Belvedere West | 96 | 96 | 25 days>100 µg/m3 |
| GB6 A2 at Falconwood | 99 | 99 | 11 days>100 µg/m3 |
Results are presented as the number of instances where monitored concentrations are greater than the objective concentration. Exceedances of the O3 objectives are shown in bold (100 µg/m3 not to be exceeded more than 10 times a year).
If the period of valid data is less than 85%, the relevant percentiles are provided in brackets.
(a) Data capture for the monitoring period, in cases where monitoring was only carried out for part of the year.
(b) Data capture for the full calendar year (e.g. if monitoring was carried out for six months the maximum data capture for the full calendar year would be 50%).
Ozone (O3) is a secondary pollutant that is not emitted directly from sources. Instead, it is formed in the atmosphere through chemical reactions between nitrogen oxides (NOₓ) and volatile organic compounds (VOCs) in the presence of sunlight. Consequently, ozone concentrations are typically higher during the spring and summer months and can affect large geographic areas. Exposure to elevated ozone concentrations can irritate the respiratory system, reduce lung function and exacerbate existing respiratory conditions such as asthma. Unlike nitrogen dioxide, which is generally highest near road traffic sources, ozone concentrations are often higher at suburban and rural locations because nitric oxide emitted from vehicles can locally reduce ozone levels.
Table K presents the 2025 ozone monitoring results from three automatic monitoring sites. The ozone objective is 100 µg/m³, not to be exceeded on more than 10 days per year. BX1 (Slade Green) met the objective, recording 10 exceedance days during 2025.
However, the objective was exceeded at BQ7 (Belvedere West) and GB6 (A2 at Falcon wood), where concentrations exceeded 100 µg/m³ on 25 and 11 days respectively. BQ7 recorded the highest number of exceedances, while GB6 exceeded the objective by a smaller margin. These results indicate that ozone remains a regional air quality issue influenced by both local precursor emissions and wider atmospheric processes.