Pothole Treatments
Bexley records the total number of highway defects treated, rather than only those that might specifically be classified as potholes. This approach reflects the absence of a formal definition of a pothole and our commitment to addressing all types of safety-related surface defects, not just those traditionally considered potholes. The table below provides an estimated breakdown of the number of treated defects that would generally fall within the category of potholes. These figures are based on standard working practices typically assuming one pothole per location for small scale repairs, and using average counts for larger areas where multiple potholes may have been treated. The figures are taken for Reactive Maintenance works.
| Year | Area Treated (m2) | Potholes Resolved |
|---|---|---|
| 2020 to 2021 | 1,450 | 1,414 |
| 2021 to 2022 | 1,480 | 1,786 |
| 2022 to 2023 | 2,638 | 2,032 |
| 2023 to 2024 | 3,047 | 2,595 |
| 2024 to 2025 | 2,353 | 2,590 |
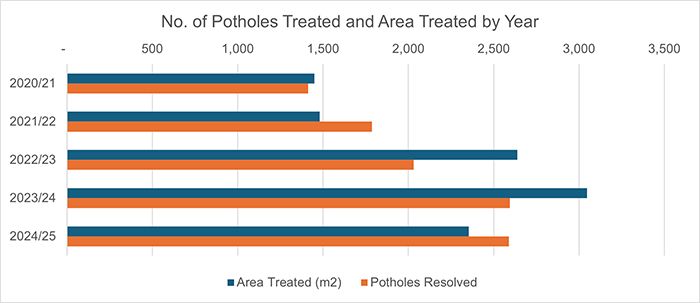
The table shows that the number of potholes filled has steadily increased from 2021 to 2022 to 2023 to 2024 from 1,414 to 2,595; an increase of 83%. The figure for 2024 to 2025 is very similar to last year, showing that this high level of repair work is being maintained, with more Preventative Maintenance funding likely resolving small defects before developing into actionable potholes.