Contents
- Executive summary for the Pharmaceutical Needs Assessment (PNA) 2025
- Section 1: Introduction
- Section 2: Context for the PNA
- Section 3: NHS pharmaceutical services provision, currently commissioned
- Section 4: Other services that may impact on pharmaceutical services provision
- Section 5: Findings from the public questionnaire
- Section 6: Analysis of health needs and pharmaceutical service provision
- Section 7: Conclusions
- Appendix A: List of pharmaceutical service providers in Bexley by locality
- Appendix B: PNA project plan
- Appendix C: PNA Steering Group terms of reference
- Appendix D: Public questionnaire
- Appendix E: Consultation stakeholders
- Appendix F: Summary of consultation responses
- Appendix G: Consultation comments
- Appendix H: List of Abbreviations
- Supplementary Statements and map updates
3. Section 2: Context for the PNA
The PNA is undertaken in the context of the health, care and wellbeing needs of the local population. These are usually laid out in the JSNA of the local area. The strategies for meeting the needs identified in JSNAs are contained in the Joint Local Health and Wellbeing Strategies.
This section aims to present health needs data that might be of relevance to pharmacy services. It is not an interpretation of pharmaceutical service provision requirements for Bexley. This section should be read in conjunction with these detailed documents. Appropriate links have been provided within each subsection. There are opportunities for the ICB and HWB to maximise CPCF services to support the Bexley Health and Wellbeing strategy.
2.1 NHS Long Term Plan (LTP)
NHS LTP1 was published in January 2019, and it set out the priorities for healthcare for the next ten years. It is wide-ranging and includes chapters on new service models, action on prevention and health inequalities, and progress on care quality and outcomes.
Priority clinical areas in the LTP include:
There are specific aspects of the LTP that include community pharmacy and pharmacists:
- section 4.21 states that ‘Pharmacists have an essential role to play in delivering the Long Term Plan’ and goes on to state: ‘In community pharmacy, we will work with government to make greater use of community pharmacists’ skills and opportunities to engage patients, while also exploring further efficiencies through reform of reimbursement and wider supply arrangements’
- section 1.10 refers to the creation of ‘fully integrated community-based healthcare. This will be supported through the ongoing training and development of multidisciplinary teams in primary and community hubs. From 2019, NHS 111 started to directly book into GP practices across the country, as well as referring on to community pharmacies who support urgent care and promote patient self-care and self-management’
- section 1.12 identifies ‘pharmacist review’ of medication as a method to reduce avoidable A&E attendances, admissions and delayed discharge, streamlining patient pathways to reduce avoidable outpatient visits and over-medication
- section 3.68 identifies community pharmacists as part of the process of improving the effectiveness of approaches such as the NHS Health Check, ‘rapidly treating those identified with high-risk conditions’, including high blood pressure
- section 3.86 states: ‘We will do more to support those with respiratory disease to receive and use the right medication.’ Of NHS spend on asthma, 90% goes on medicines, ‘but incorrect use of medication can also contribute to poorer health outcomes and increased risk of exacerbations or even admission’
- section 6.17 identifies ten priority areas. Section 6.17(v) identifies pharmacists as key in delivering value for the £16 billion spent on medicines annually. It states: ‘Research shows as many as 50% of patients do not take their medicines as intended and pharmacists will support patients to take their medicines to get the best from them, reduce waste and promote self-care’
The LTP has implications for the current CPCF Essential Services (Essential Services (ES)1.4.1.4.1) and Advanced Services (1.4.1.4.2), by providing benefits to the ICS to maximise these services into care pathways. Services such as the Hypertension case-finding service, Pharmacy First, PCS and NMS can help meet the needs of the LTP.
A new 10-Year Health Plan is currently being developed and looks to modernise and change to meet the needs of the changing population2.
The following are key elements:
- moving care from hospitals to communities
- making better use of technology
- focusing on preventing sickness, not just treating it
The plan is due to be published in July 2025.
2.2 Core20PLUS5
Core20PLUS53 ‘is a national NHSE approach to support the reduction of health inequalities at both national’ and ICS level. The targeted population approach focuses on the most deprived 20% of the national population (CORE20) as identified by the Index of Multiple Deprivation (IMD) and those within an ICS who are not identified within the core 20% but who experience lower than average outcomes, experience or access i.e. people with a learning disability and hidden deprivation in coastal communities (PLUS). Additionally, there are five key clinical areas:
- maternity
- severe mental illness
- chronic respiratory disease
- early cancer diagnosis
- hypertension case-finding
2.3 Joint Strategic Needs Assessment (JSNA)
The purpose of JSNAs and related JLHWSs (see below) is ‘to improve the health and wellbeing of the local community and reduce inequalities for all ages. They are not an end in themselves, but a continuous process of strategic assessment and planning. The core aim is to develop local evidence-based priorities for commissioning that will improve the public’s health and reduce inequalities. Their outputs, in the form of evidence and the analysis of needs, and agreed priorities, will be used to help to determine what actions local authorities, the local NHS and other partners need to take to meet health and social care needs, and to address the wider determinants that affect health and wellbeing’4. The PNA should therefore be read alongside the JSNAs.
As mentioned previously in Section 1.4, the Bexley JSNA content is within the Bexley Data Observatory, and is regularly updated; so there is no fixed date of publication5.
2.4 Bexley Joint Local Health and Wellbeing Strategy (JLHWS) and ICS priorities
Building on the evidence provided by the JSNA, the Bexley JLHWS6 outlines the key priorities and the actions being taken to meet Bexley’s health and wellbeing needs.
The Bexley JLHWS aims to ensure the borough’s residents can lead fulfilling and healthy lives. It focuses on prevention, early help, reducing health inequalities and addressing wider determinants, including education and housing. The golden thread running through the strategy is environmental sustainability, including climate change.
It has four key priorities covering the whole life-course:
- children and young people
- obesity
- mental health
- ageing well
Bexley’s JLHWS was directly informed by local community engagement and actions include making it easier for residents to find information and making it easier for residents to access relevant services.
Bexley is part of the South East London ICS alongside five other boroughs: Lambeth, Southwark, Lewisham, Greenwich and Bromley.
The strategic priorities for the SEL ICS are:
- prevention and wellbeing - Improving prevention of ill health, helping people in South East London to stay healthy and well.
- early years - Making sure that children get a good start in life and there is effective support for mothers, babies, and families before birth and in the early years of life.
- children's and young people’s mental health - Improving children’s and young people’s mental health, making sure they have quick access to effective support for common mental health challenges.
- adults’ mental health - Making sure adults have quick access to early support, to prevent mental health challenges from worsening.
- primary care and people with long-term conditions - Making sure people have convenient access to high-quality primary care and improving support and care for people with long-term conditions.’7
2.5 Bexley Integrated Forward Plan
The Integrated Forward Plan8 builds on how the JLHWS will implemented by the Bexley Wellbeing Partnership who are made up of 17 local partners which include:
- SEL ICB
- LBB
- NHS Lewisham and Greenwich Trust
- Greenwich and Bexley Community Hospice
- Bexley Voluntary Service Council
It focuses on the four priorities with a clear plan with detailed workstreams to meet the objectives and what enablers are required.
2.6 Bexley the place
The London Borough of Bexley is located in south-east London, bordering with Kent to the east, Bromley to the south, Greenwich to the west, and the Thames to the north. LBB is made up of 17 wards, which were defined in 2018, and are not coterminous with the 21 wards used in the 2021 census.
The population is diverse and classified as urban with major conurbation under the Rural Urban Classification 20119. NB: This data was due to be updated in line with the 2021 Census in November 2023. It was removed from the release calendar to allow for further review10. The timelines for the 2021 release at time of writing were uncertain.
An understanding of the size and characteristics of the Bexley population, including how it can be expected to change over time, is fundamental to assessing population needs and for the planning of local services. This section provides a summary of the demographics of Bexley residents, how healthy they are, and what changes can be expected in the future.
2.6.1 Population overview
Bexley has a population of 246,466 which is a 6.3% increase from 201111. The largest locality population is in North Bexley (98,452) and the smallest is in Frognal (68,245).
Figure 3: Map to show population density across Bexley with contractors overlayed
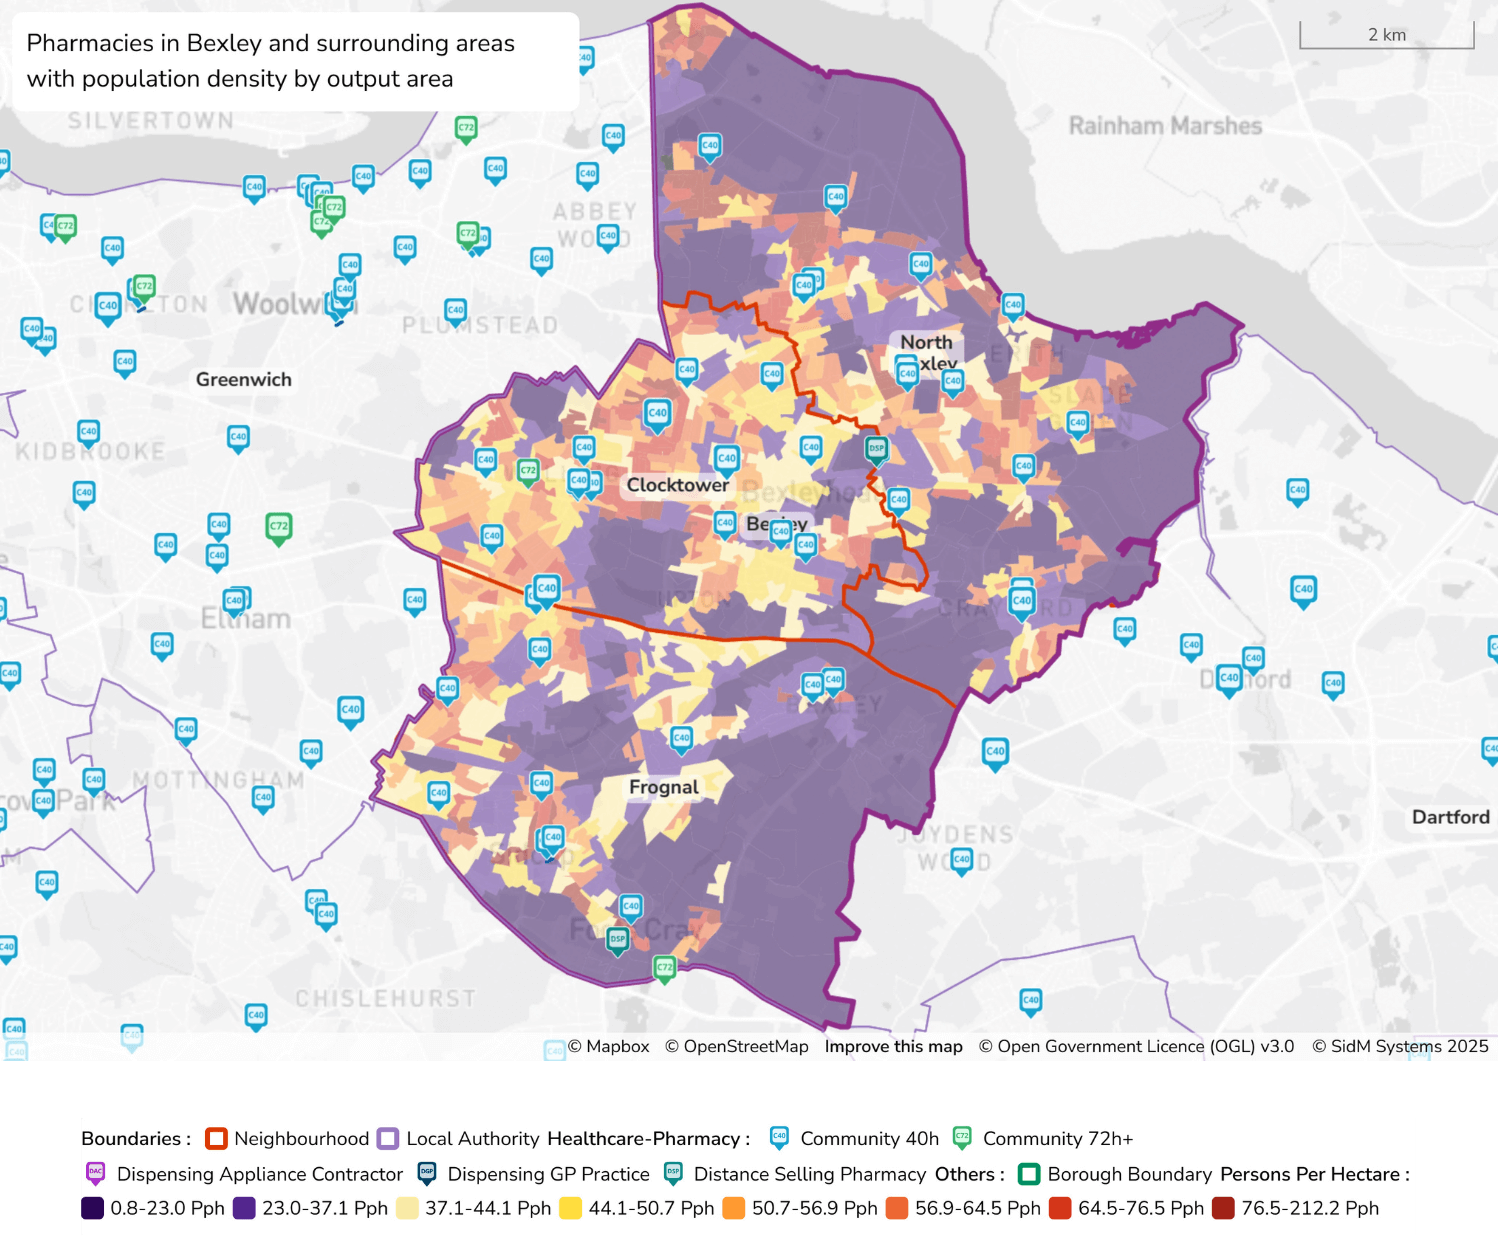
Figure 3 - text description
- This map illustrates the distribution of pharmacies across the London Borough of Bexley and surrounding areas, overlaid with population density data by output area. The borough boundary is marked with a purple line, while the three localities are outlined in orange. Population density is shown using a colour gradient ranging from light purple (0.8–23.0 persons per hectare) in low-density areas to dark red (76.5–212.2 persons per hectare) in the highest-density zones, with the most densely populated regions concentrated in Clocktower and in the centre of North Bexley. Various pharmacy types are represented with specific icons: light blue symbol and green symbol (C40 and C72+) for community pharmacies open 40 or 72+ hours per week respectively. And teal icons with the letter DSP for distance selling pharmacies. Clocktower contains 15 pharmacies, concentrated in its most populated sections; North Bexley has 16 pharmacies, particularly near Erith and along the northern edge by the River Thames; Frognal, which is less densely populated, has 14 pharmacies more sparsely distributed. This makes up the Bexley Borough with 45 community pharmacies in total. The surrounding areas of Eltham, Greenwich, and Dartford are also shown, though in grayscale, providing regional context beyond Bexley’s boundary and showing pharmacies located throughout their respective areas. The River Thames forms the borough’s northern border, with Rainham Marshes visible across the water.
2.6.2 Age and sex
Table 2 shows the age structure of Bexley population, which is similar to that of London, with the largest proportion at 15-64 years (64.1% compared to 70%), and lowest proportion at 65 years and over (16.6% compared to 12.1%). The figures for England are similar for people aged 15-64 years with 63%, although the number of people aged 65 and older is the same as under 15 year olds (18.4% and 18.6%)12.
| Area | Under 15 years | 15-64 years | 65 years and over |
|---|---|---|---|
| Bexley | 19.3% | 64.1% | 16.6% |
| London | 17.9% | 70.0% | 12.1% |
| England | 18.6% | 63.0% | 18.4% |
Source: Office for National Statistics (ONS). Census 2021.
Table 3 shows the age structure of Bexley within each age range.
| Age | Bexley | London | England |
|---|---|---|---|
| Aged 4 years and under | 6.1% | 5.9% | 5.4% |
| Aged 5 to 9 years | 6.6% | 5.9% | 5.9% |
| Aged 10 to 15 years | 7.9% | 7.2% | 7.2% |
| Aged 16 to 19 years | 4.5% | 4.4% | 4.6% |
| Aged 20 to 24 years | 5.5% | 6.7% | 6.0% |
| Aged 25 to 34 years | 13.0% | 18.1% | 13.6% |
| Aged 35 to 49 years | 20.6% | 22.7% | 19.4% |
| Aged 50 to 64 years | 19.3% | 16.9% | 19.4% |
| Aged 65 to 74 years | 8.6% | 6.5% | 9.8% |
| Aged 75 to 84 years | 5.6% | 3.8% | 6.1% |
| Aged 85 years and over | 2.4% | 1.6% | 2.4% |
Source: ONS. Census 2021.
There is a slightly smaller proportion of men (48%) compared to women (52%), and this is similar to both London and England (49% and 51%).
| Sex | Bexley | London | England |
|---|---|---|---|
| Female | 52% | 51% | 51% |
| Male | 48% | 49% | 49% |
Source: LBB. Bexley Data Hub.
The age groups in Bexley are not split evenly between the localities, see Table 5. The age-groups across the localities follows the same pattern for people aged 0-14s, 15-24, 25-64 and 65 and over by percentage.
Frognal has similar figures to North Bexley for 15-24 by percentage (11.4 compared to 11.8), with Clocktower lower (10.3).
North Bexley has lowest number of 65 and over with 12.6, compared to 18.7 for Clocktower and 19.9 for Frognal13.
| Locality | Total population | Population aged 0 to 14 | Population aged 15 to 24 | Population aged 25 to 64 | Population aged 65 and over (%) |
|---|---|---|---|---|---|
| North Bexley | 98,452 | 21.7% | 11.8% | 53.9% | 12.6% |
| Clocktower | 79,769 | 18.1% | 10.3% | 52.9% | 18.7% |
| Frognal | 68,245 | 17.4% | 11.4% | 51.3% | 19.9% |
| Bexley | 246,466 | 19.3% | 11.2% | 52.9% | 16.6% |
| London | 8,866,180 | 17.9% | 12.6% | 57.4% | 12.1% |
| England | 56,490,048 | 17.4% | 11.7% | 52.4% | 18.6% |
Source: ONS. Census 2021.
The age structure for Bexley’s population is similar to England. See Figure 3
Figure 4: Age profile for residents across Bexley and comparison with England
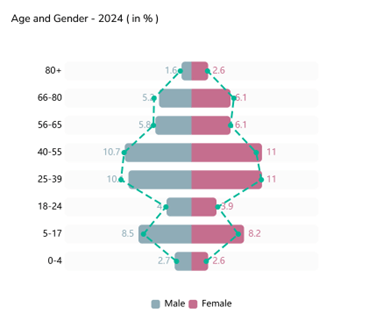
Source: NHS Digital 2024
Figure 4 - text description
- This population pyramid chart illustrates the age and gender distribution of Bexley population in 2024, expressed as percentages. The chart is split vertically, with males represented by blue bars on the left and females by pink bars on the right. Each horizontal bar shows the proportion of the total population within a specific age group, ranging from 0–4 years at the bottom to 80+ years at the top. The largest age groups are the 25–39 and 40–55 brackets, each making up around 10.7%–11% of the population for both genders, indicating a relatively young and working-age dominant population. The 5–17 and 18–24 age groups are also well represented, though slightly smaller, ranging from 3.9% to 8.5%, with a fairly balanced gender split. The older age groups (66 and above) show a declining share, particularly for males, with the 80+ group being the smallest—only 1.6% male and 2.6% female, reflecting increased female longevity. The shape of the chart resembles a diamond or spindle, broadest in the middle age ranges and narrower at the extremes, suggesting a mature but not aging population with a stable workforce base. This distribution may indicate moderate birth rates, balanced gender proportions, and a healthcare system supporting longevity, particularly for women. There is a line to compare each of the age groups with the England population, which has a similar distribution although England has a higher number of males aged 25-39 and 66-80, and a lower number of females aged 5-17 and 40-55.
2.6.3 Predicted population growth
Population projections are an indication of the future trends in population over the next 25 years. They are trend-based projections, which means assumptions for future levels of births, deaths and migration are based on observed levels mainly over the previous five years. They show what the population will be if recent trends continue. They are not forecasts and do not attempt to predict the impact that future government or local policies, changing economic circumstances or other factors might have on demographic behaviour14.
In 2043, the projected resident population in Bexley is expected to be 273,898, an 8.7% increase on 2022 estimates. For all London Boroughs (excluding City), the mean projected resident population is 306,390. This is the total projected resident population in the reference year based on the 2018 mid-year population estimates.
The current population growth predictions for Bexley are shown in Table 6 and Table 7 below.
| 2020 | 2025 | 2025 | 2030 | 2030 | ||
|---|---|---|---|---|---|---|
| 65+ | Female | 2,2948 | 24,103 | (+1,155) | 26,639 | (+2,691) |
| 65+ | Male | 18,128 | 19,528 | (+1,400) | 21,836 | (+3,708) |
| 16-64 | Female | 80,504 | 83,460 | (+2,956) | 86,126 | (+5,622) |
| 16-64 | Male | 75,111 | 76,599 | (+1,488) | 78,434 | (+3,323) |
| 0-15 | Female | 24,722 | 24,503 | (-219) | 23,622 | (-1,100) |
| 0-15 | Male | 25,998 | 25,547 | (-451) | 24,622 | (-1,366) |
Source: Updated from GLA 2021-based Demographic Projections.
| Locality | 2025 | 2026 | 2027 | 2028 | 2029 | 2030 |
|---|---|---|---|---|---|---|
| North Bexley | 0.33% | 0.29% | 0.25% | 0.28% | 0.29% | 0.28% |
| Clocktower | 0.46% | 0.44% | 0.43% | 0.44% | 0.44% | 0.42% |
| Frognal | 0.48% | 0.48% | 0.47% | 0.47% | 0.48% | 0.46% |
| Bexley | 0.41% | 0.39% | 0.37% | 0.38% | 0.39% | 0.37% |
Source: ONS. Population projections for local authorities 2020 and LSOA population estimates 2024.
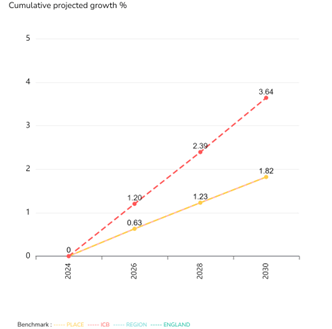
Figure 5: Cumulative projected growth15
Figure 5 - text description
- The figure shows a line graph showing Cumulative Projected Growth (%) which illustrates projected cumulative growth for Bexley population from 2024 to 2030. The vertical axis represents growth percentages ranging from 0% to 5%, while the horizontal axis marks the years 2024, 2026, 2028, and 2030. Two lines are shown on the graph, each representing different areas. A red dashed line, representing England, starts at 0% in 2024 and rises sharply to 1.20% in 2026, 2.39% in 2028, and reaches 3.64% by 2030, indicating the highest growth among the groups. A yellow solid line, representing Bexley, also starts at 0% in 2024 but increases more gradually, reaching 0.63% in 2026, 1.23% in 2028, and 1.82% by 2030, showing more modest growth. Overall, the chart highlights a significant difference in projected growth between the local and national areas over the six-year period.
2.6.4 Number of households
There was a 2.9% growth in the number of households in Bexley between 2011 and 2021 as shown in Table 8.
| 2011 | 2021 | change | |
|---|---|---|---|
| Number of households | 92,604 | 95,300 | 2.9% |
Source: ONS 2011 and Bexley Data Hub.
| Locality | Total dwelling 2022 | Total dwelling 2023 | change |
|---|---|---|---|
| Bexley | 100,022 | 100,594 | 0.6% |
Source: ONS. Census 2021.
2.6.5 Household projections
In 2043, the projected number of households in Bexley is expected to be 115,942 a 15.2% increase from 2022. One person households will account for 30.0% and households with dependent children will account for 27.1%. This is the total projected number of households in the reference year based on the 2018 based projections.
Household projections are not an assessment of housing need and do not take account of future policies. They are an indication of the likely increase in households given the continuation of recent demographic trends16.
2.6.6 Planned developments
| Planning reference | Status | Site name/ address | Developmental proposal | Number of units | Scheduled completion dates |
|---|---|---|---|---|---|
| 22/01564/FULM | Approved | Former Electrobase/Wheatsheaf Works, Maxim Road, Crayford | Redevelopment of the site to provide new housing, including affordable housing | 559 | Single phase 2027-28 |
| 21/00932/OUTEA | Granted subject to s106 | Crabtree Manorway South, Belvedere | Redevelopment of the site to provide new housing, including affordable housing, and commercial floor space | 1,250 | Phased (five phases) from 2026-27 to 2034-35 |
| 21/01948/OUTEA | Granted pending S106 | South Thamesmead (Phases 3 to 7) (Wolvercote Road and Coralline Walk), Abbey Wood | Redevelopment of the site to provide new housing, including affordable housing, and commercial floor space | 1,950 | Phased (five phases) from 2027-28 to 2033-34 |
| 23/02922/FULM | Submitted (with case officer) | Belvedere Gas Holders, Yarnton Way, Belvedere | Redevelopment of the site to provide new housing, including affordable housing, and commercial floor space | 392 | Single phase 2028-29 |
| TOTAL | 4,151 |
2.6.7 Car or van availability
Census 2021 data shows that the overall percentage of households who have access to a car or van is 77.6% in Bexley compared to 57.9% London and 76.5% in England17.
| Locality | households with access to a car or van |
|---|---|
| North Bexley | 72.5% |
| Clocktower | 80.9% |
| Frognal | 81.3% |
| Bexley | 77.6% |
Source: ONS 2021.
2.6.8 Travel to work and working location
Table 12 shows how Bexley residents aged 16 and over (and in employment the week before census 2021) travelled to work. The largest proportion (36%) of these residents travelled by car or van, followed by those working at home (34.5%) and this is the same as England (44.5% and 31.5% respectively). London is different, where the largest proportion of residents are working at home (42.1%), followed by those travelling by car or van (20.6%).
| Transport to work | Bexley | London | England |
|---|---|---|---|
| Work mainly at or from home | 34.5% | 42.1% | 31.5% |
| Underground, metro, light rail, tram | 2.4% | 9.9% | 1.9% |
| Train | 10.3% | 5.3% | 2.0% |
| Bus, minibus or coach | 6.6% | 8.9% | 4.3% |
| Taxi | 0.6% | 0.5% | 0.7% |
| Motorcycle, scooter or moped | 0.7% | 0.7% | 0.5% |
| Driving a car or van | 36% | 20.6% | 44.5% |
| Passenger in a car or van | 2.5% | 1.5% | 3.9% |
| Bicycle | 0.8% | 3.0% | 2.1% |
| On foot | 4.5% | 6.4% | 7.6% |
| Other method of travel to work | 1.2% | 1.2% | 1.0% |
Source: ONS. Census 2021.
2.6.9 Ethnicity
In line with neighbouring boroughs, Bexley is diverse, and its population is continuing to diversify over time. ‘28.1% of residents are from an ethnic minority background (excluding white minorities). Including white minorities, 35.6% of residents are from an ethnic minority background’18.
Figure 6: Map to show ethnicity across Bexley with pharmacies overlayed
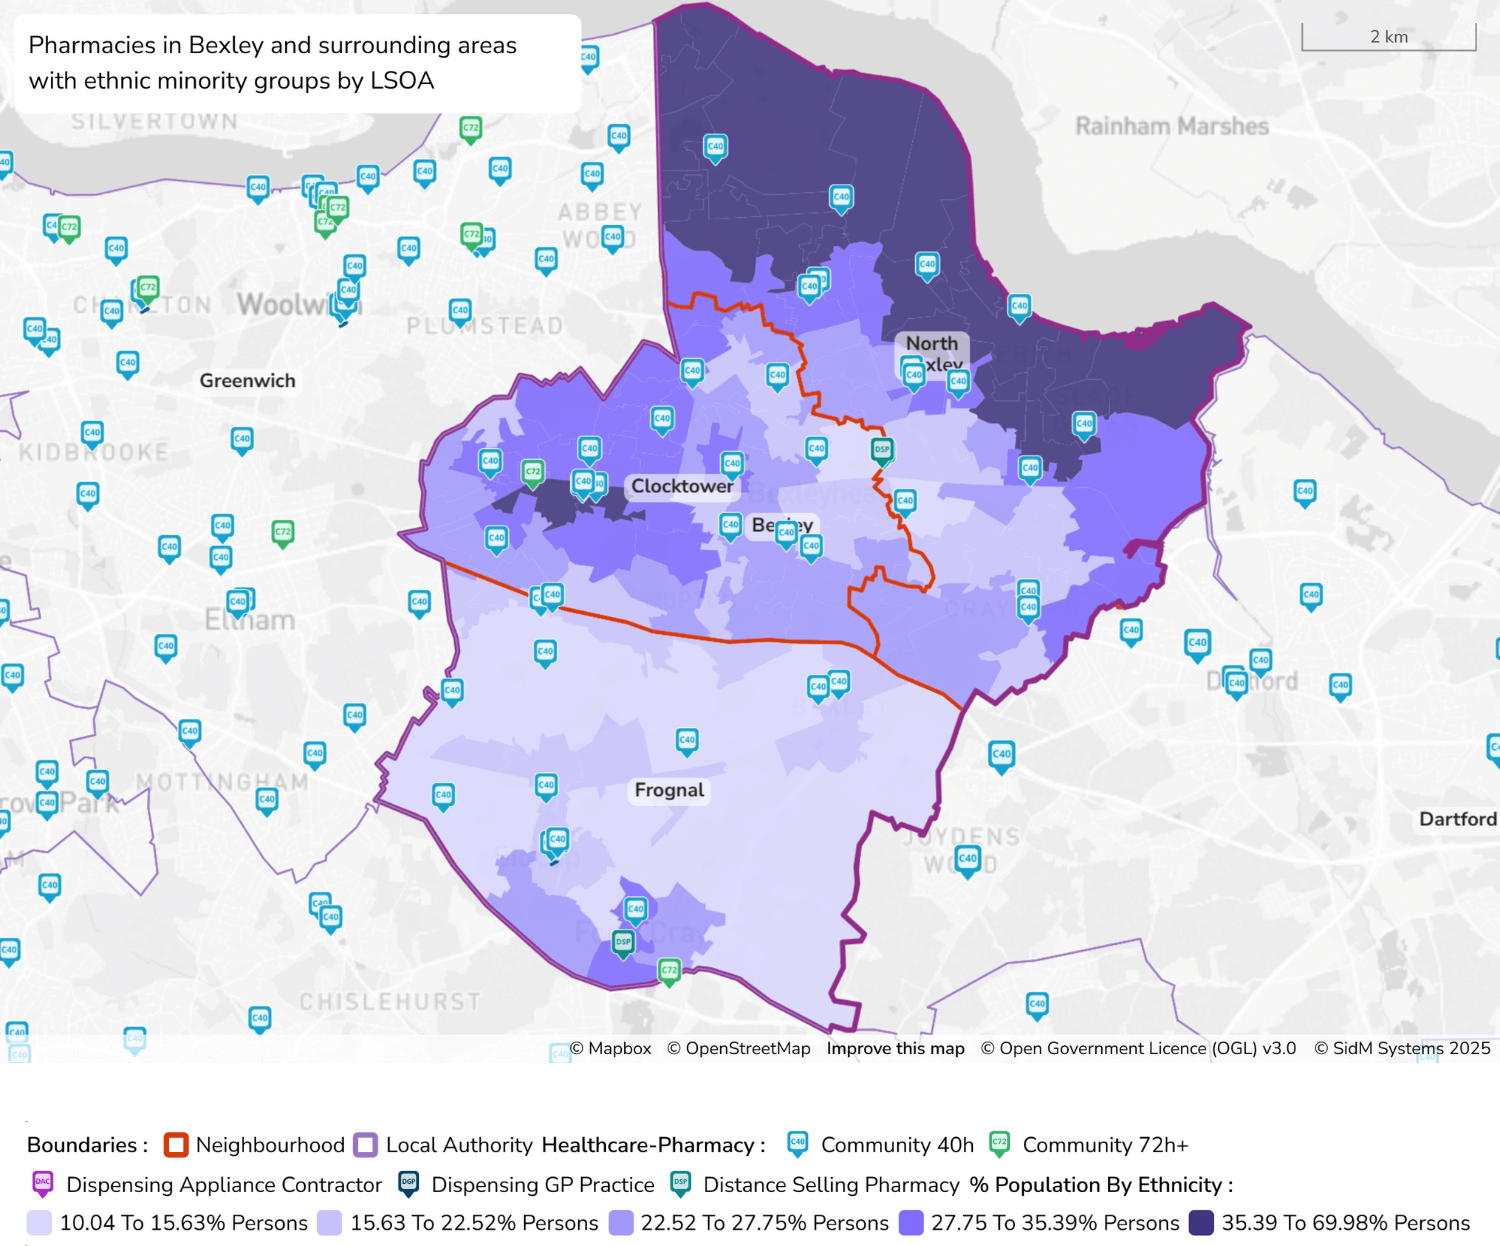
Figure 6 - text description
- This map illustrates the distribution of pharmacies across the London Borough of Bexley and its surrounding areas, overlaid with data on the proportion of ethnic minority populations by Lower Super Output Area (LSOA). The map uses a gradient of purple shading to indicate the percentage of residents from ethnic minority backgrounds, ranging from light purple (10.04% to 15.63%) to very dark purple (35.39% to 69.98%). Darker areas, such as North Bexley and the centre of Clocktower, reflect higher ethnic diversity, while lighter areas like Frognal and the borough’s southern edges indicate lower diversity. Pharmacy services are marked using icons: community pharmacies open for 40 or more hours per week are shown in blue, those open for 72+ hours in green and distance-selling pharmacies in teal. These pharmacy locations are most densely clustered in the central and northern parts of Bexley, particularly around areas with higher ethnic minority populations such as Clocktower. The locality boundaries are outlined in orange, and the local authority boundary of Bexley is marked in dark purple. Surrounding areas, including parts of Greenwich and Dartford, are also partially visible. The map reveals a notable correlation between pharmacy density and areas with higher ethnic diversity, suggesting that service provision may be aligned with population need or health demand. Conversely, areas with fewer pharmacies tend to correspond to neighbourhoods with lower percentages of ethnic minority residents such as Frognal where the percentage of ethnic minority groups is mostly 10.04-15.63%.
Figure 6 shows the proportions of the population in each ethnic group in 2021, the most recent year for which Census population data is available by ethnic group19. The table shows how the population identified themselves. The largest proportion is the White ethnic group (71.9%), followed by Black (12.2%), Asian (9.9%) and Mixed ethnic groups (3.5%). The smallest proportion in Bexley is the Other ethnic group (2.5%). Comparatively, the Asian ethnic group is a larger proportion in both London and England (20.7% and 9.6% respectively), and the Black ethnic group is a smaller proportion (13.5% and 4.2% respectively)20.
Census data from 2021 shows a 3.7 percentage point increase in the Black ethnic group from 8.5% in 2011, which ‘was the largest increase among high-level ethnic groups in this area’21.
Clocktower is the locality with the largest proportion of people from the Asian ethnic group with 13.8%, compared to Frognal with 9.0% with the lowest. North Bexley has the largest percentage of people from the Black ethnic group, with 22.6%, most than five times that of England with 4.2%. Frognal has the largest percentage of people from the White ethnic group, with 84.5% which is similar to England (81%) and far higher than London (53.8%)22.
| Ethnicity | Clocktower | Frognal | North Bexley | Bexley | London | England |
|---|---|---|---|---|---|---|
| White | 73.6% | 84.5% | 61.7% | 71.9% | 53.8% | 81% |
| Asian, Asian British or Asian Welsh | 13.8% | 6.7% | 9.0% | 9.9% | 20.7% | 9.6% |
| Black, Black British, Black Welsh, Caribbean or African | 6.4% | 4.0% | 22.6% | 12.2% | 13.5% | 4.2% |
| Mixed or Multiple ethnic groups | 3.2% | 3.2% | 4.1% | 3.5% | 5.7% | 3.0% |
| Other ethnic group | 3.0% | 1.6% | 2.6% | 2.5% | 6.3% | 2.2% |
Source: ONS. Census 2021.
2.6.10 Religion
Religious affiliations for Bexley are shown in Table 14, which shows the percentage of people who identified with a particular religious group, as defined by a set of Census categories. The three largest religious groups in Bexley in ascending order are Christian (50%), No religion (33.6%) and Not answered (5.7%). The two largest religious groups in London and England are the same, 40.7% and 46.3% for Christian and 27.1% and 36.7% for No religion respectively. The third largest religious group in London and England is Muslim, with 15% and 6.7% respectively23.
| Religion | North Bexley | Clocktower | Frognal | Bexley |
|---|---|---|---|---|
| Christian | 52% | 48% | 50% | 50% |
| Buddhist | 1% | 1% | 1% | 1% |
| Hindu | 2% | 5% | 2% | 3% |
| Jewish | 0% | 0% | 0% | 0% |
| Muslim | 5% | 4% | 3% | 4% |
| Sikh | 3% | 3% | 1% | 2% |
| No religion | 32% | 33% | 37% | 34% |
| Other religion | 0% | 0% | 0% | 0% |
| Religion not stated | 5% | 6% | 6% | 6% |
Source: ONS. Census 2021.
2.6.11 Household languages
Table 15 shows the proportion of households who have English as their main language. The majority of Bexley residents have English as a main language (88.4%), which is the same as London (73.2%) and England (89.3%), although it is higher than London. The proportion of Bexley residents with no people with English as a main language in the household (4.7%) is lower than London (12.4%), and the overall picture is the same as England24.
| Household language | Bexley | London | England |
|---|---|---|---|
| All adults in household have English as main language | 88.4% | 73.2% | 89.3% |
| At least one but not all adults in household have English as main language | 4.9% | 11.2% | 4.3% |
| No adults in household, but at least one person aged 3 to 15 years, has English as main language | 2.0% | 3.3% | 1.4% |
| No people in household have English as main language | 4.7% | 12.4% | 5.0% |
Source: ONS. Census 2021.
Figure 6 shows areas within Bexley with the highest number of households where no one in household has English as their main language, with North Bexley being the highest and Frognal being the lowest.
Figure 7: Map to show areas where there are no people in the household who speak English as their first language
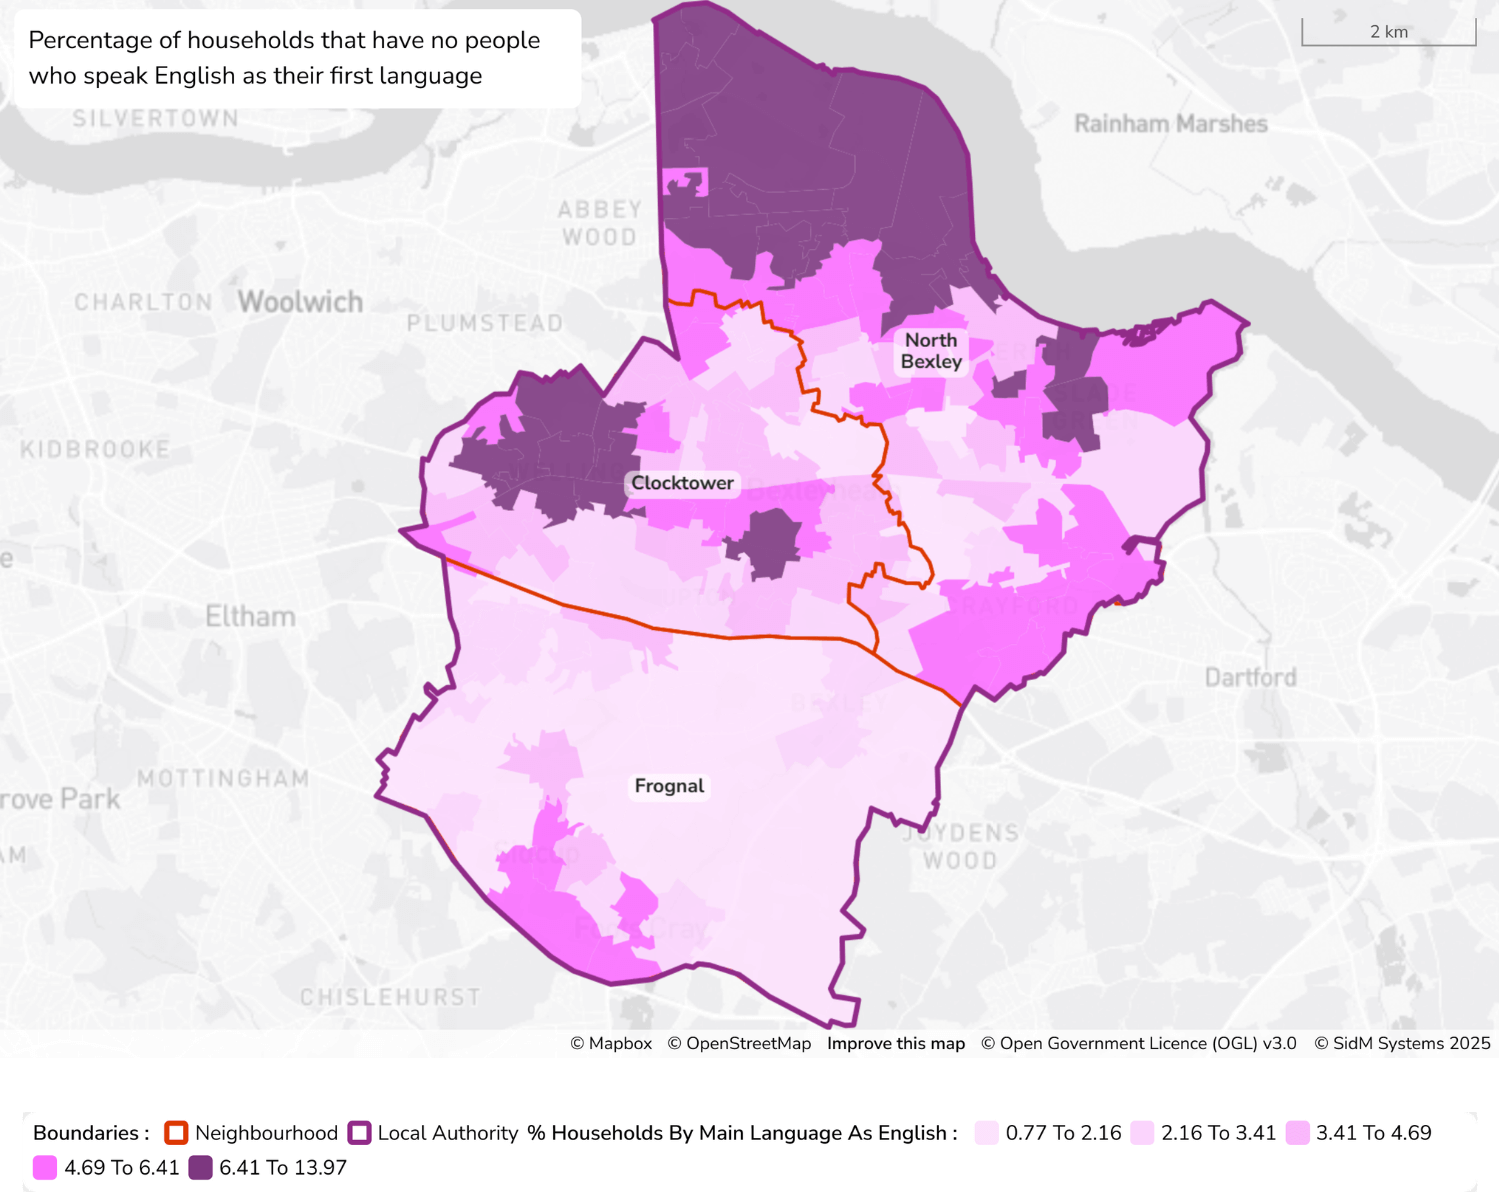
Figure 7 - text description
- The map illustrates the percentage of households across the localities of North Bexley, Clocktower, and Frognal where no residents speak English as their primary language. Areas are shaded in purple, with darker shades indicating higher proportions (6.41%–13.97%) of non-English-speaking households. North Bexley and Clocktower show distinct pockets of dark purple, signifying that these localities contain notably higher proportions of households where English is not the main language, particular in the northwest of North Bexley. Frognal, by contrast, predominantly appears lighter, indicating a lower proportion overall, although there are small areas of moderate concentration. Locality boundaries are clearly outlined in orange, facilitating easy comparison between areas.
2.6.12 Births and marriages
Bexley’s ‘birth rate is declining. There were 2,765 births in 202225. The average age when giving birth was 31 years old26. At the time of the Census, 46% of the population aged 16 and over are married or in a civil partnership. A further 11% were divorced or separated27.
The number of marriages has been steady from 2014 excluding 2020/21 when they fell significantly due to coronavirus. In 2022 they returned to pre-pandemic levels with 712 marriages, which included 15 same-sex marriages28. There were 16 civil partnerships (15 opposite sex and one same sex) in 202229. Each year, around 2% of marriages are for same-sex couples’30.
2.6.13 Sexual orientation
Sexual orientation refers to people who identify as lesbian, gay, bisexual and queer/questioning (LGBQ+).
‘Sexual orientation was a voluntary question in the 2021 census; 7% of residents aged 16 and over did not answer. 2.11% of the population aged 16 and over identified with an LGB+ orientation. This is over 4,000 people in total: around 2,000 gay or lesbian, 1,500 bisexual, 350 pansexual and 150 asexual, queer or other sexual orientations. The remaining 91% identified as straight or heterosexual. Bexley has a lower LGB+ population than London (4.3%) and England & Wales (3.2%)’.31
2.6.14 Sex and gender identity
‘The 2021 Census is the first official data on the size of the transgender population in England & Wales. This was a voluntary question in the 2021 census; 6% of residents aged 16 and over did not answer (both for England & Wales and Bexley). Over 1,000 people aged over 16 in Bexley did not identify with their registered sex at birth (0.5%)’.32
2.6.15 Gypsy and traveller populations
The 2021 census estimated that there were 621 gypsies and travellers in Bexley, with the highest number in North Bexley (481).
| Locality | Population |
|---|---|
| Clocktower | 78 |
| Frognal | 62 |
| North Bexley | 481 |
Source: ONS. Census 2021.
2.6.16 Vulnerable Populations
2.6.16.1 Disability
‘The Equality Act 2010 defines a disabled person as someone with a physical or mental injury. It must be substantial or long-term (likely to last more than 12 months) and affect their ability to conduct day-to-day activities.
In 2021, 36,083 residents had one or more disability/illness, similar to the 37,053 in 2011. This is 14.6% of the population, compared to 16% in 2011. For 8.4% of residents their disability/illness limits day-to-day activities a little, and for a further 6.2% their day-to-day activities are limited a lot. 29.3% of households in Bexley reported that they have at least one person living there with an illness or disability.
Health and age are closely related, with older people being more likely to be in poorer health. ONS have calculated an age-standardised percentage (ASP) of 15.4% for Bexley to compare to other geographies which will have a different population size and age profile. The 15.4% is made up from 8.8% (ASP) of residents where their disability/illness limits day-to-day activities a little, and 6.6% (ASP) where their day-to-day activities are limited a lot’.33
The following are facts about Bexley residents:
- 0.4% of residents have a learning disability
- 3.4% of school-aged pupils in Bexley have a learning disability
- the rate per 10,000 for children in need due to a child’s disability or illness was 41.2 in 2018
- 20% of residents (aged 16 to 64) are disabled (core or work-limiting disabled) in 2021
- the employment rate for residents with a disability (aged 16 to 64) is 59.2% (2021)
- in 2021 to 2022, 16.4% of 16 to 64 aged residents with learning disabilities were in paid employment
- 5% of adults in contact with secondary mental health services were in paid employment
- in 2022 to 2023, 10.6% (4722) of pupils were identified as having SEN Support; higher than the previous two years but lower than the five years prior to that
- 4.2% (1,877) of pupils had an Education and Health Care Plan (EHCP) or a statement of Special Educational Needs (SEN). This has increased in recent years from 2.6% in 2015/16
- 94% of 16-17-year-olds with an ECHP or statement of SEN were participating in education or training and 6% were not or their activity not known.’34
2.6.16.2 Children and young people in care and adult safeguarding
As of 2023, there were 265 children under the care of the LA, a rate of 46 per 100,000. This is less than the London rate of 51 per 100,000 and the England rate of 71 per 100,000.
| Area | Number (2023) | Rate per 100,000 (2023) |
|---|---|---|
| England | 83,840 | 71 |
| London | 9,710 | 51 |
| Bexley | 265 | 46 |
Source: Department for Education. Children looked after in England
In 2022-23 there were 18 adults in care in Bexley, a rate of 12 per 100,000, same as the London rate but lower than the England rate of 15 per 100,000.
| Area | Number | Rate per 100,000 |
|---|---|---|
| England | 5,020 | 15 |
| London | 682 | 12 |
| Bexley | 18 | 12 |
Source: Updated NHS Digital Measures from the Adult Social Care Outcomes Framework, England, 2022-23.
2.6.16.3 Homeless and rough sleepers
As of 2018, there were 1,234 people in temporary accommodation in Bexley, most of which live in privately owned residences. There has not been an update since the last PNA regarding those in temporary accommodation in Bexley.
| Temporary accommodation | Number |
|---|---|
| Bed and breakfast (including shared annexe) | 124 |
| Private sector leased (by LA or housing authority) | 402 |
| Other types (including private landlord) | 690 |
| Total | 1,234 |
Source: GLA Statutory homelessness by borough
There were 39 people seen rough sleeping by outreach services in Bexley according to the April to June 2024 Combined Homelessness and Information Network report. This is likely an underestimate as it represents observed incidence during specific outreach exercises.
| Age | Number |
|---|---|
| 0–17 | 0 |
| 18–25 | 3 |
| 26–35 | 12 |
| 36–45 | 5 |
| 46–55 | 12 |
| 55+ | 7 |
| Total | 39 |
Source: CHAIN Quarterly Report Outer Boroughs Jul–Sep 21
2.6.16.4 Housebound populations
No exact data is held on the number of housebound people in Bexley. Approximately 2,364 are registered housebound by their GPs.
2.6.16.5 Residential and nursing home populations
There are 31 nursing homes in Bexley with a capacity of 1,457. The majority of this capacity is in the Frognal locality.
| Locality | Homes | Capacity |
|---|---|---|
| North Bexley | 11 | 362 |
| Clocktower | 5 | 308 |
| Frognal | 15 | 787 |
2.7 Deprivation
The socioeconomic status of an individual or population is determined by characteristics including income, education and occupation, and lower socioeconomic status. These are associated with poorer health outcomes, including low birthweight, CVD, diabetes and cancer.
Index of Multiple Deprivation (IMD) data (2019) combines socioeconomic indicators to produce a relative socioeconomic deprivation score and include the domains of:
- income
- employment
- health deprivation and disability
- education, skills and training
- barriers to housing and services
- crime
- living environment
Income and employment domains carry the most weight in the overall IMD rank. Deprivation varies significantly across Bexley and this can be seen in Figure 8 below.
Figure 8: Map to show deprivation across Bexley with pharmacies overlayed
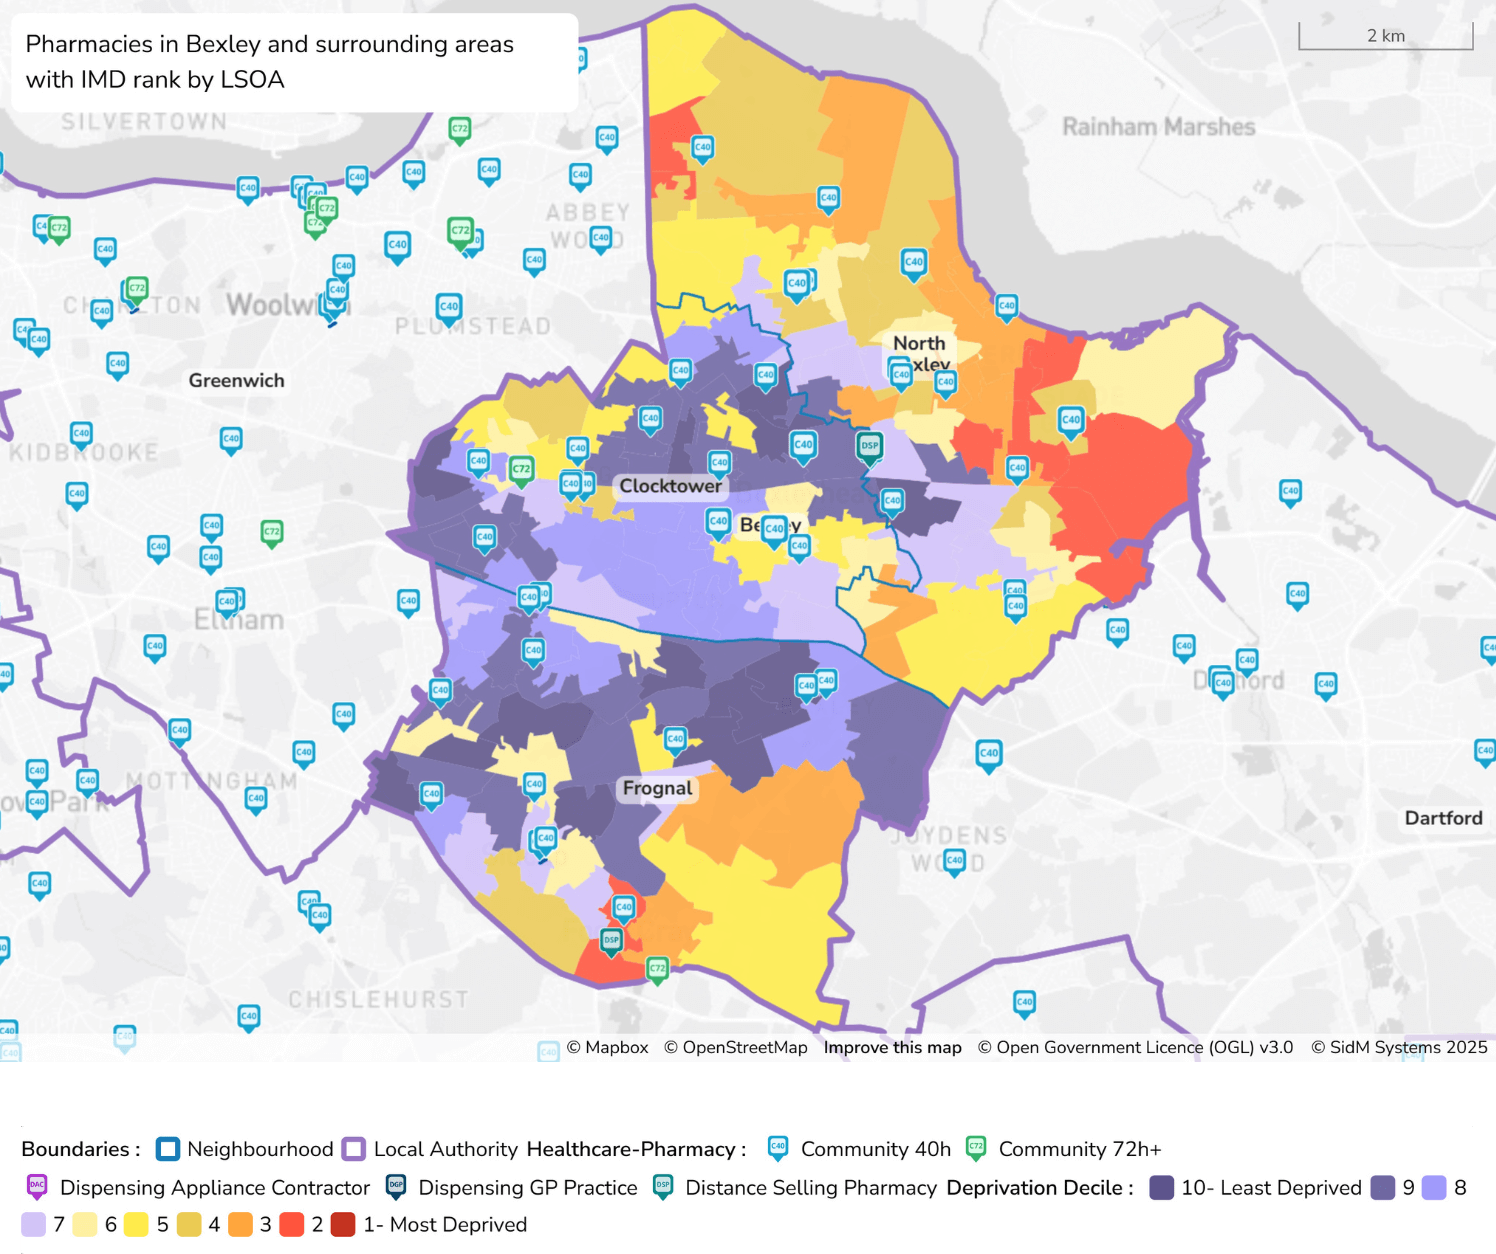
Figure 8 - text description
- This map presents the distribution of pharmacies across the London Borough of Bexley and surrounding areas, overlaid with deprivation data based on the Index of Multiple Deprivation (IMD) rankings by Lower Super Output Area (LSOA). Areas are shaded using a ten-colour scale to reflect deprivation deciles, where dark blue and purple represent the least deprived areas (deciles 10 and 9) and dark red signifies the most deprived (decile 1). The most deprived areas, shown in red and orange, are concentrated in the eastern part of Bexley, including the majority of North Bexley, and also in the southern area of Frognal. In contrast, the least deprived areas, shaded in dark blue and purple, are more prevalent in the central and western parts of the borough. Localities are outlined in dark blue, and the borough boundary is marked in dark purple. Pharmacies are plotted using distinct icons: blue for community pharmacies open 40+ hours, green for those open 72+ hours and teal for distance-selling pharmacies. Clusters of pharmacies appear throughout the borough but are especially dense in and around more deprived areas such as Clocktower, North Bexley, and southern Frognal, suggesting that pharmacy access may be targeted towards communities with greater socio-economic need. Overall, the map highlights a spatial relationship between higher deprivation and the density of pharmacy services, indicating a potentially equitable distribution of community pharmacy access relative to local deprivation levels.
IMD data (2019) shows that Bexley is ranked 190 out of 317 local authorities across the whole of England, where 1 is the most deprived and 317 is the least deprived35.
Figure 9: IMD Ranking for Bexley36
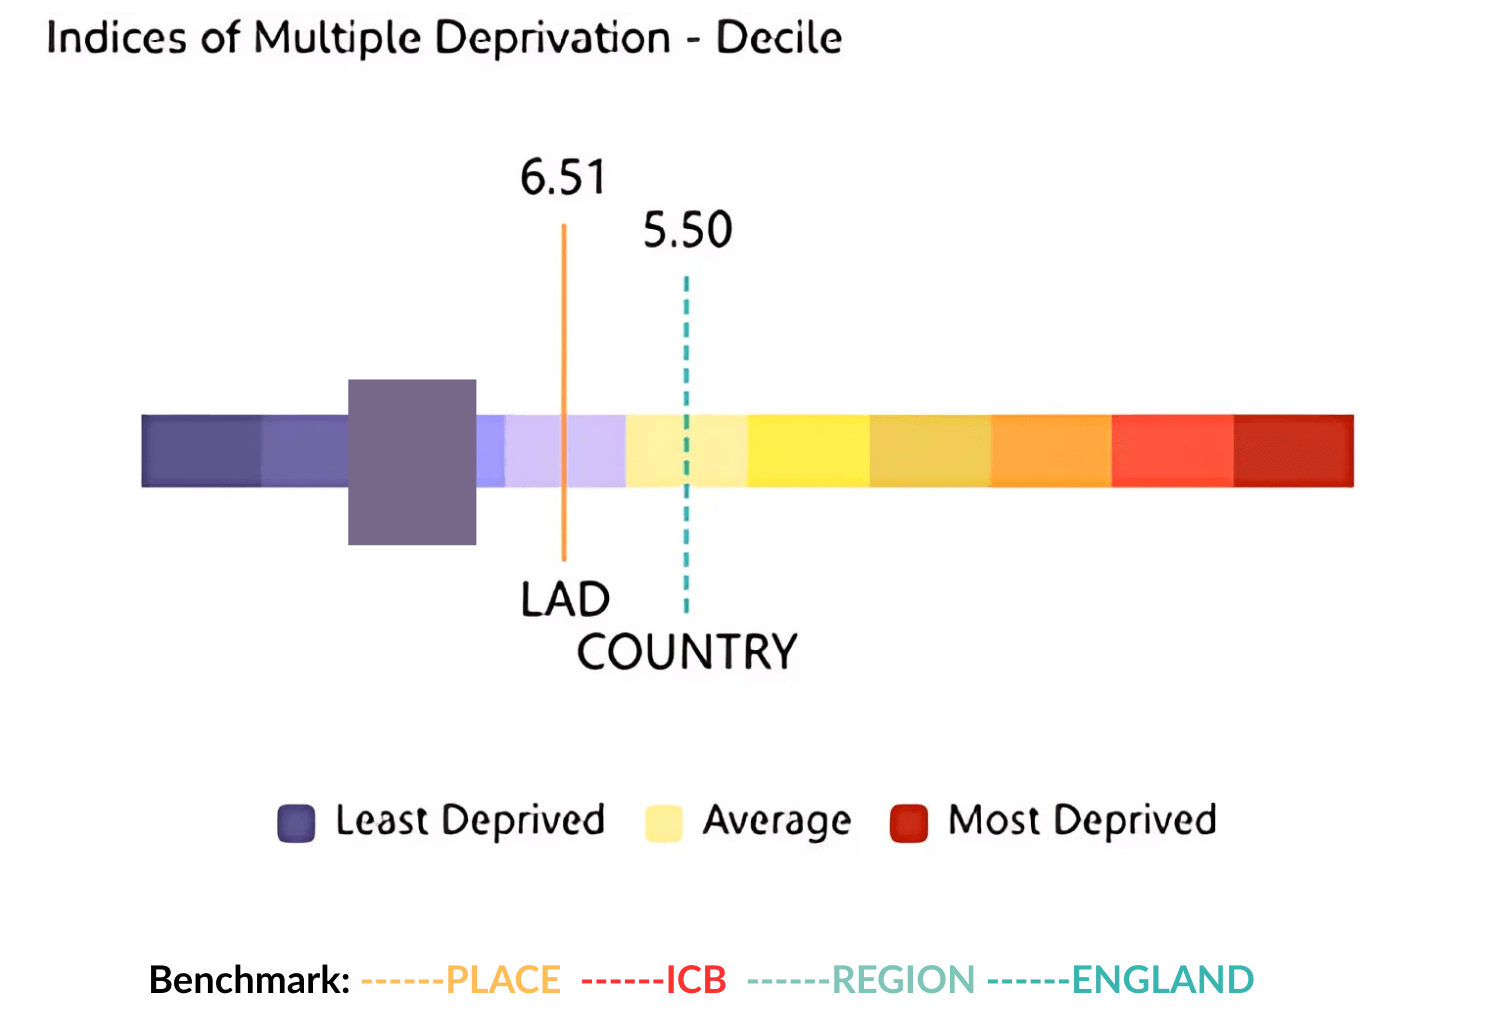
Figure 9 - text description
- The image shows the Indices of Multiple Deprivation (IMD) decile score for the local authority (Bexley) compared to the country average. It uses a colour gradient ranging from dark purple (least deprived) through yellow (average deprivation) to red (most deprived). Bexley (LAD) has a score of 6.51, placing it slightly towards the less deprived side, compared to the national average of 5.50, which is positioned around the middle of the scale. This indicates that Bexley is less deprived than the country as a whole.
There is a distinct difference in levels of deprivation across the three localities in Bexley, with North Bexley being the most deprived and Clocktower being least deprived.
| Locality | IMD Quintile |
|---|---|
| North Bexley | 2.58 |
| Clocktower | 4.15 |
| Frognal | 4.12 |
| Bexley | 3.53 |
| England | 3.0 |
Source: Ministry of Housing, Communities and Local Government. English indices of deprivation 2019.
2.8 Health of the population
Population health indicators provide a high-level overview of the collective health of populations at a national, regional and local level. These indicators allow comparisons to be made regarding the health of different populations and can highlight issues or trends in time that require a more detailed investigation.
2.8.1 Life expectancy
Life expectancy37 at birth for Bexley residents was higher for males (66.4 years) than female (63.9) in 2018-20. Although the figures are similar to England’s life expectancy, male life expectancy at birth was higher for Bexley males (66.4 vs 63.1 in England).
| Indicators | Bexley male | Bexley female | London male | London female | England male | England female |
|---|---|---|---|---|---|---|
| Life expectancy at birth | 66.4 | 63.9 | 63.8 | 65.0 | 63.1 | 63.9 |
| Healthy Life Expectancy (HLE) at 65 | 10.8 | 9.6 | 10.3 | 11.2 | 10.5 | 11.3 |
Source: PHOF/ Office for Health Improvement and Disparities (OHID).
2.8.2 Health behaviours
Obesity
The Quality and Outcomes Framework (QOF) prevalence of patients registered as obese in Bexley is similar to England but higher than London.
Body Mass Index (BMI) is the method used to calculate an individual’s weight, through measurements of height and weight38.
| Bexley | London | England | |
|---|---|---|---|
| QOF Prevalence, % of patients aged 18 or over with a BMI greater than or equal to 30 in the previous 12 month | 14% | 11% | 13% |
Source: OHID Fingertips.
Childhood obesity
North Bexley has the highest percentage of children in both age groups considered obese or with severe obesity.
| Indication | Clocktower | Frognal | North Bexley |
|---|---|---|---|
| Reception prevalence of obesity (including severe obesity) | 8.8% | 7.9% | 13.7% |
| Year 6 prevalence of obesity (including severe obesity) | 21.6% | 18.7% | 27.7% |
Source: OHID Local Health.
Smoking
Smoking prevalence in Bexley is 13.3%, which is lower than England prevalence at 14.7%.
| Indication | Bexley | England |
|---|---|---|
| Smoking prevalence in adults aged 15+ – current smokers | 13.3% | 14.7% |
Source: Updated NHSE Smoking prevalence from QOF.
Alcohol misuse
Alcohol specific mortality is higher in Bexley for both London and England. The rate of those using specialist misuse services is higher in Bexley (1.7) than London (1.5) but lower than England (1.9).
| Indication | Bexley | London | England |
|---|---|---|---|
| Adults in treatment at specialist alcohol misuse services *2020-21 | 1.7 | 1.5 | 1.9 |
| Alcohol-specific mortality (2022) | 21.2 | 12.0 | 14.8 |
Source: Updated OHID Fingertips.
Drug misuse
The table below shows the prevalence of drug misuse across Bexley. The prevalence is lower across Bexley for the numbers associated with deaths from drug misuse (1.9) compared to London (3.6) and England (5.2).
| Indication | Bexley | London | England |
|---|---|---|---|
| Adults in treatment at specialist drug misuse services: rate per 1,000 population (18+) - (2020-22) | 3.6 | 4.0 | 4.5 |
| Successful completion of drug treatment: opiate users 18+ (2022) | 6.8 | 5.3 | 5.0 |
| Successful completion of drug treatment: non opiate users 18+ (2022) | 26.6 | 32.8 | 31.4 |
| Deaths from drug misuse- all ages (2020-22) | 1.9 | 3.6 | 5.2 |
Source: OHID Fingertips.
Sexual health
Bexley (1574.4) has a lower chlamydia detection rate than both London (2027.8) and England (1961.7) and a lower Sexually Transmitted Infection (STI) diagnostic rate compared to both London and England.
There is a higher conception and abortion rate in Bexley than London with a lower birth rate of those under 18 in Bexley.
| Indication | Bexley | London | England |
|---|---|---|---|
| Chlamydia detection rate (aged 15–24) per 100,000 (2023) | 1,571.4 | 2,027.8 | 1,961.7 |
| New STI diagnoses (excluding chlamydia, under 25 years) per 100,000 (2023) | 386.1 | 1,228.8 | 519.9 |
| Under-18 conception rate per 100,000 (2021) | 1,197 | 947 | 1,308 |
| Under- 18 birth rate per 100,000 (2022) | 174 | 195 | 340 |
| % of under 18 conception leading to abortion 2021 | 750 | 550 | 650 |
Source: Updated OHID Fingertips.
Oral health
There is a lower number of children aged five with visually obvious tooth decay in Bexley (20.4) when compared to London and England.
| Indication | Bexley | London | England |
|---|---|---|---|
| 5 year olds with experience of visually obvious dental decay (2021-22) | 20.4% | 25.8% | 23.7% |
Source: Updated fingertips.
Accidental injuries
There is a higher incidence of accidental injuries in North Bexley when compared to the other two localities.
| Indication | North Bexley | Clock Tower | Frognal |
|---|---|---|---|
| Emergency hospital admissions in under 5 year olds | 187.5 | 169.1 | 147.1 |
| Emergency hospital admissions in under 15 year olds | 78.8 | 71.4 | 72.0 |
| Emergency hospital admissions in under 15 to 24 year olds | 110.7 | 86.8 | 82.2 |
Source: Updated OHID Local Health.
Falls and hips
| Indication | Bexley | London | England |
|---|---|---|---|
| Emergency hospital Admissions to falls in people aged 65 and over (2022-23) | 1,944.3 | 2,070.6 | 1,932.8 |
| Hip fractures in people aged 65 and over (2022-23) | 586.5 | 502.3 | 558.0 |
Source: Updated OHID Fingertips.
Palliative care
| Indication | Bexley | London | England |
|---|---|---|---|
| NHS-D QOF Palliative care | 0.0064% | 0.0036% | 0.0057% |
Source: Updated from NHS Digital QOF 23-24.
2.9 Burden of disease
Long-term conditions are more prevalent in people over the age of 60 (58%) compared with people under the age of 40 (14%), and in people in more deprived groups, with those in the poorest social class having a 60% higher prevalence than those in the richest social class and 30% more severity of disease39.
Please note that the locality figures below show the QOF prevalence for Bexley as a whole and for the PCNs within Bexley as data at locality level was unavailable. QOF data shows recorded prevalence, therefore the anticipated prevalence may be higher with unmet need for the conditions which contribute to premature mortality.
| Condition | North Bexley PCN | Clocktower PCN | Frognal PCN | APL Bexley PCN | Bexley | England |
|---|---|---|---|---|---|---|
| Heart Failure | 0.72% | 0.88% | 0.86% | 1.06% | 0.83% | 0.87% |
| Asthma | 5.2% | 4.8% | 5.3% | 5.9% | 5.24% | 6.52% |
| Atrial Fibrillation | 1.3% | 2.0% | 2.5% | 2.8% | 1.93% | 2.13% |
| Cancer | 2.8% | 3.9% | 4.2% | 4.2% | 3.54% | 3.49% |
| Stroke | 1.4% | 1.70% | 1.9% | 1.9% | 1.66% | 1.85% |
| Diabetes | 8.6% | 7.8% | 7.3% | 7.2% | 7.86% | 7.45% |
| Coronary Heart Disease | 2.1% | 2.8% | 3.0% | 3.1% | 2.58% | 2.99% |
| Peripheral Arterial Disease | 0.4% | 0.4% | 0.5% | 0.5% | 0.41% | 0.57% |
| Hypertension | 13.4% | 15.4% | 15.5% | 16.4% | 14.66% | 14.42% |
| Chronic Obstructive Pulmonary Disease | 1.7% | 1.6% | 1.7% | 1.9% | 1.70% | 1.85% |
| Rheumatoid Arthritis | 0.8% | 0.8% | 0.8% | 0.9% | 0.78% | 0.76% |
Source: OHID Fingertips.
Heart Failure
- APL Bexley PCN reports the highest prevalence (1.06%), significantly exceeding the England average (0.87%) and the Bexley average (0.83%)
- North Bexley PCN has the lowest prevalence (0.72%), also below the national average
Asthma
- all PCNs are below the national average with Clocktower PCN having the lowest incidence
Atrial Fibrillation
- APL Bexley PCN shows the highest prevalence (2.8%) followed by Frognal PCN (2.5%), both exceeding the Bexley (1.93%) and England (2.13%) averages
- North Bexley PCN has the lowest prevalence (1.3%), below the national and local averages
Cancer
- Frognal and APL Bexley PCNs report the highest prevalence (4.2%), exceeding the England (3.5%) and Bexley (3.54%) averages
- North Bexley PCN has the lowest prevalence (2.8%), below both local and national averages
Stroke
- Frognal and APL Bexley PCNs report the highest prevalence (1.9%), higher than the Bexley and national averages
- North Bexley PCN shows the lowest prevalence (1.4%), slightly below the Bexley average (1.66%)
Diabetes
- North Bexley PCN (8.6%) and Clocktower PCN both report a higher prevalence than Bexley and national averages
- APL Bexley PCN has the lowest prevalence (7.2%) in Bexley and lower than the national average
Coronary Heart Disease
- APL Bexley PCN (3.1%) and Frognal PCN (3.0%) both have a higher prevalence compared to the Bexley (2.58%) and England (2.99%) averages
- North Bexley PCN has the lowest prevalence (2.1%), below both the local and national averages
Peripheral Arterial Disease
- Frognal and APL Bexley PCNs report the highest prevalence (0.5%), higher than the Bexley (0.41%) average but lower than the England average (0.57%)
- North Bexley and Clocktower PCNs have the lowest prevalence (0.4%), slightly below the Bexley average (0.41%)
Hypertension
- APL Bexley PCN reports the highest prevalence (16.4%), exceeding both the Bexley (14.66%) and England (14.42%) averages
- North Bexley PCN shows the lowest prevalence (13.4%), below the local and national averages
Chronic Obstructive Pulmonary Disease
- APL Bexley PCN reports the highest prevalence (1.9%), slightly higher than the England average (1.85%)
- Clocktower PCN has the lowest prevalence (1.6%), slightly below the Bexley average (1.7%)
Rheumatoid Arthritis
- APL Bexley PCN shows the highest prevalence (0.9%), slightly above the Bexley (0.78%) and England averages (0.76%)
- other PCNs, including Frognal, North Bexley, and Clocktower, all report a prevalence of 0.8%, matching the national average
Figure 10: Map to show broad location of Primary Care Networks (PCNs) across Bexley
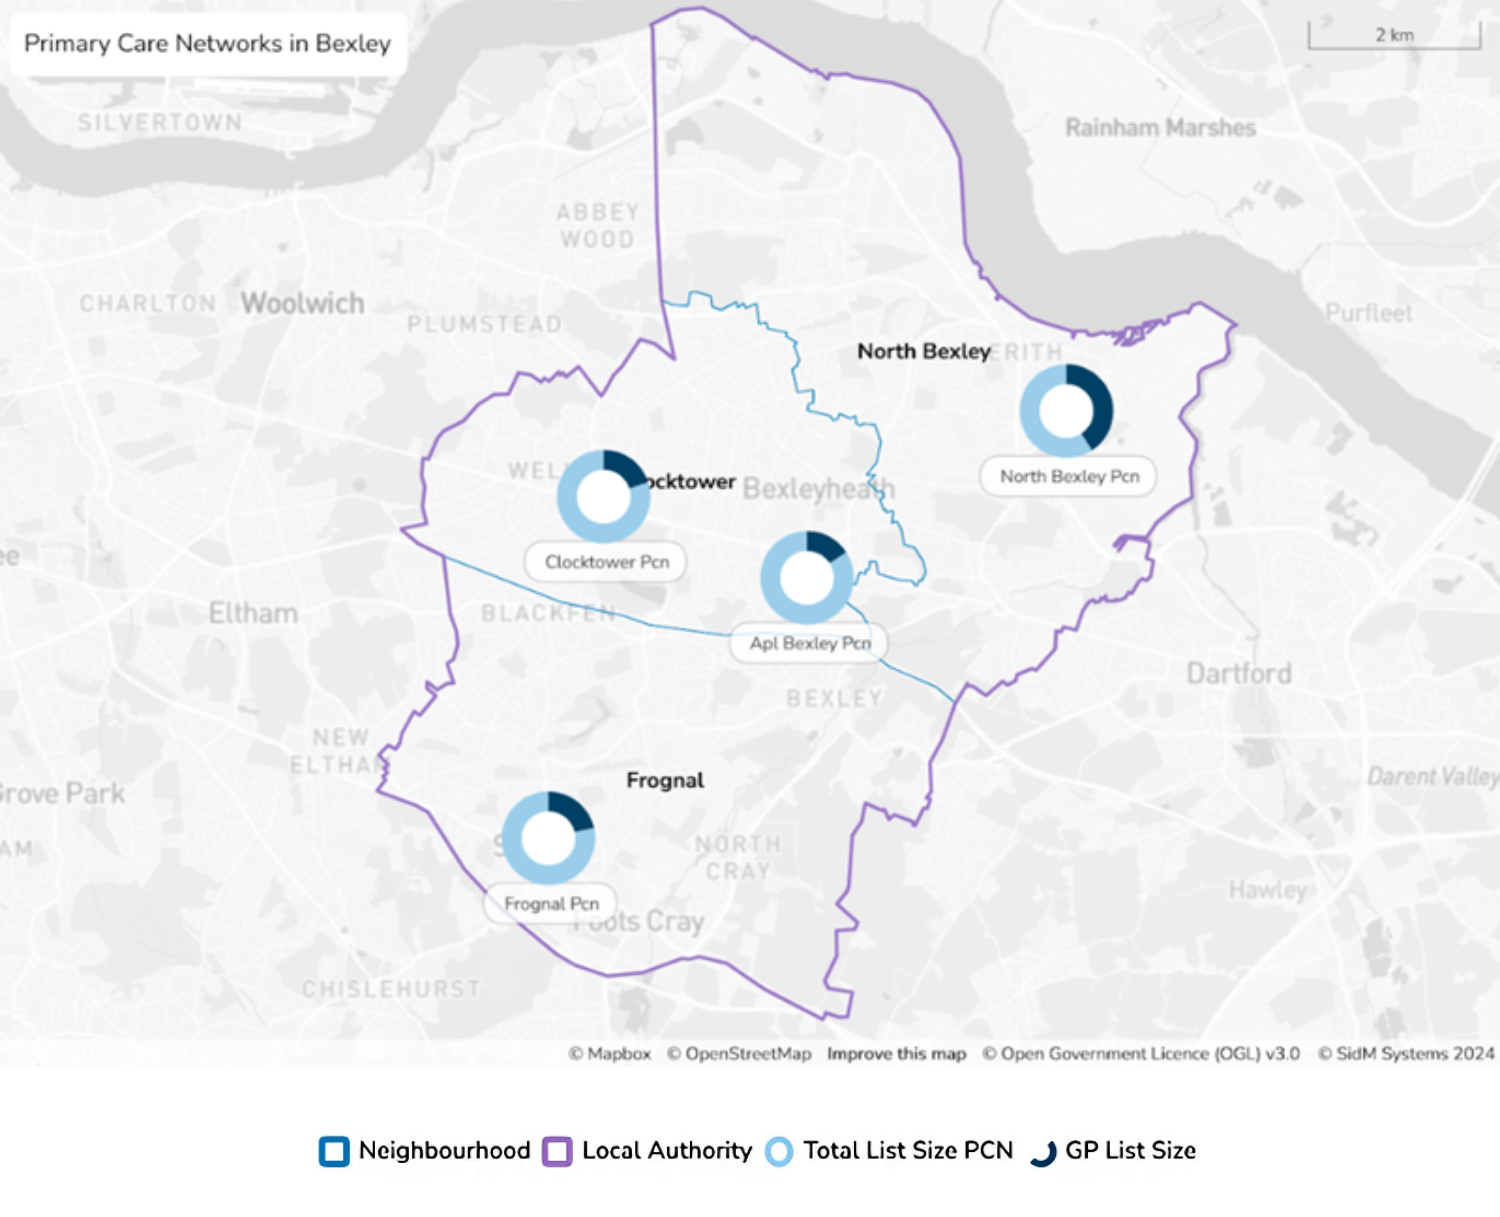
Figure 10 - text description
- The map illustrates the Primary Care Networks (PCNs) within Bexley, identifying four PCN areas: North Bexley PCN, Clocktower PCN, APL Bexley PCN and Frognal PCN, and the three Bexley localities of North Bexley, Clocktower and Frognal. Each area is represented by a circular chart showing the total patient list size for each PCN (light blue circle) and the proportion of this list covered by GP practices within each network (dark blue segment). All four PCNs have large total patient list sizes, with GP practice coverage proportionally similar across the PCNs. Locality boundaries (blue) and the local authority boundary (purple) are clearly shown for geographical reference.
| Condition | Frognal PCN | North Bexley PCN | Clocktower PCN | APL Bexley PCN | Bexley | England |
|---|---|---|---|---|---|---|
| Learning difficulties | 0.5% | 0.5% | 0.5% | 0.4% | 0.48% | 0.56% |
| Depression | 11.2% | 12.5% | 11.1% | 12.2% | 11.72% | 13.25% |
| Epilepsy | 0.8% | 0.7% | 0.7% | 0.7% | 0.71% | 0.8% |
| Dementia | 1.4% | 0.5% | 0.8% | 0.9% | 0.8% | 0.74% |
| Mental Health (all ages) | 0.8% | 1.0% | 0.7% | 0.7% | 0.86% | 1.0% |
Source: OHID Fingertips.
Learning difficulties
- APL Bexley PCN (0.4%) has the lowest prevalence when compared to the other PCNs (0.5% across the other three) and significantly lower than the national average( 0.56%).
Depression
- Depression rates vary across PCNs, but as a whole, Bexley (11.72%) has a lower prevalence when compared to the England average of 13.25%.
Epilepsy
- Frognal PCN (0.8%) aligns with the national average (0.8%) and exceeds the Bexley average (0.71%).
- North Bexley, Clocktower, and APL Bexley PCNs all report 0.7%, slightly below both the national and local averages.
Dementia
- Dementia prevalence ranges from 0.5% to 1.4%, with Frognal PCN reporting the highest prevalence (1.4%), significantly above the England average (0.74%) and the Bexley average (0.80%).
- North Bexley PCN (0.5%) has the lowest prevalence, below both the local and national averages.
Mental Health (all ages)
- North Bexley PCN (1.0%) aligns with the England average and is the highest across Bexley.
- Frognal, Clocktower, and APL Bexley PCNs (0.7%) report the lowest prevalence, below both the national and Bexley averages (0.86%).
2Change NHS. Help build a health service fit for the future
3 NHSE. Core20PLUS5 (adults) – an approach to reducing healthcare inequalities
4 Department of Health and Social Care. JSNAs and JHWS statutory guidance
5 LBB. Bexley Data Observatory
6, 7 LBB. Bexley Joint Local Health and Wellbeing Strategy 2023 to 2028
8 Bexley Health Joint Forward Plan (PDF)
9 Department for Environment, Food & Rural Affairs. 2011 Local Authority Rural Urban Classification
10 ONS. Comparison of rural and urban areas in England and Wales: 2021
11 ONS. Population and household estimates, England and Wales: Census 2021
12 ONS. 2021 Census Profile for England and Wales
13 ONS. Population and household estimates, England and Wales: Census 2021
14 Local Government Association (LGA). Understanding Planning in Bexley
16 LGA. Understanding Planning in Bexley
17 ONS. 2021 Census Profile for England and Wales
18 ONS. Ethnic group, national identity, language, and religion: Census 2021 in England and Wales
19 ONS. 2011 census, accessed through LG Inform
20, 22, 23, 24 ONS. 2021 Census Profile for areas in England and Wales
21 ONS. How life has changed in Bexley: Census 2021
25 ONS. Births in England and Wales: summary tables
26 NHSE. Monthly Services Monthly Statistics
27 ONS. Legal partnership status by age, sex and local authority Census 2021
28 ONS. Marriages in England and Wales
29 ONS. Civil partnerships formation
31 ONS. Sexual orientation and gender identity: Census 2021 in England and Wales
32, 33, 34 LBB. Bexley Data Hub
37 DHSC. Fingertips Public health profiles
38 NHS. Calculate your Body Mass Index (BMI)
39 The King’s Fund. Long-term conditions and multi-morbidity 2012-2013