3. Age
| Age Profile | Amount (%) |
|---|---|
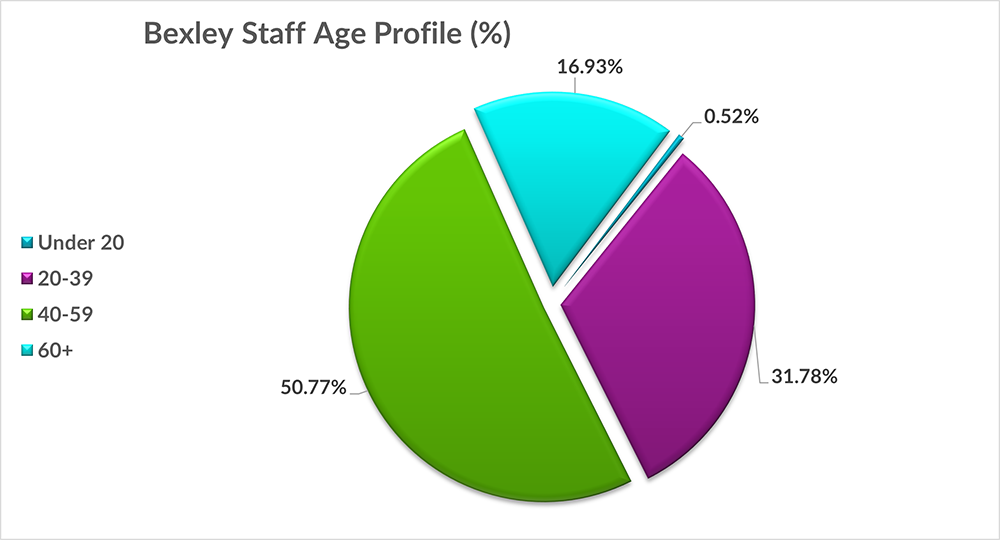
| Under 20 | 0.52% |
| 20-39 | 31.78% |
| 40-59 | 50.78% |
| 60+ | 16.93% |
Bexley Staff age profile pie chart
Image
Bexley Staff age profile pie chart figures
Chart showing the highest age profile being 40-59 with 50.77%, while the other profiles range from 31.78% (20-39) to 0.52% (Under 20's).
| Age Profile | Hay | Non-Hay | Senior Managers |
|---|---|---|---|
| Under 20 | 100.00% | 7 | 0 |
| 20-39 | 25200.00% | 231 | 7 |
| 40-59 | 41900.00% | 318 | 46 |
| 60+ | 13100.00% | 123 | 7 |
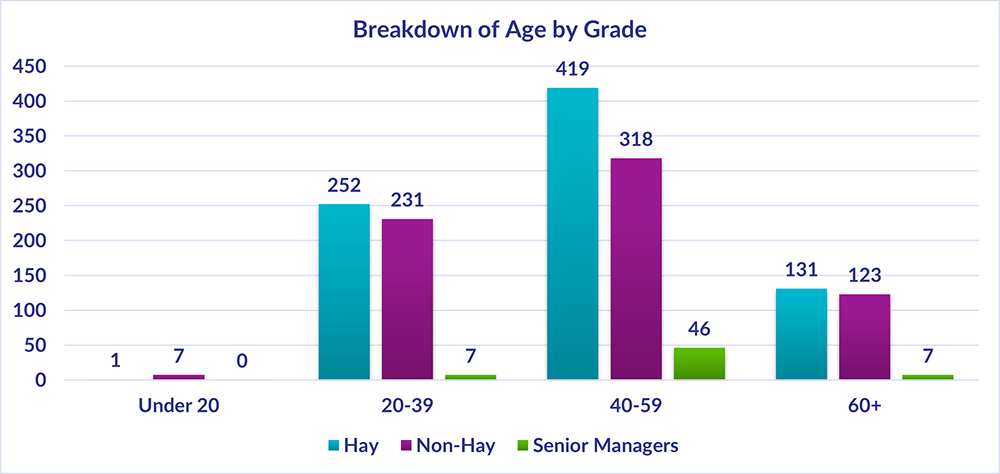
Bexley Staff age breakdown by grade chart
Image
Bexley Staff age breakdown by grade chart figures
Chart showing the breakdown of age by grade, a summary of the highest and lowest figures is 419 Hay, 318 Non-Hay and 46 Senior Managers have the age group of 40-59, whereas the lowest figures 131 Hay and 123 Non Hay and 7 Senior Managers have the age group of 60+.