4. Sexual Orientation
| Sexual Orientation | Amount (%) |
|---|---|
| Heterosexual | 71.60% |
| Gay/Lesbian/Bi-Sexual | 2.14% |
| Info not given/Prefer not to say | 26.26% |
Sexual Orientation Pie Chart
Image
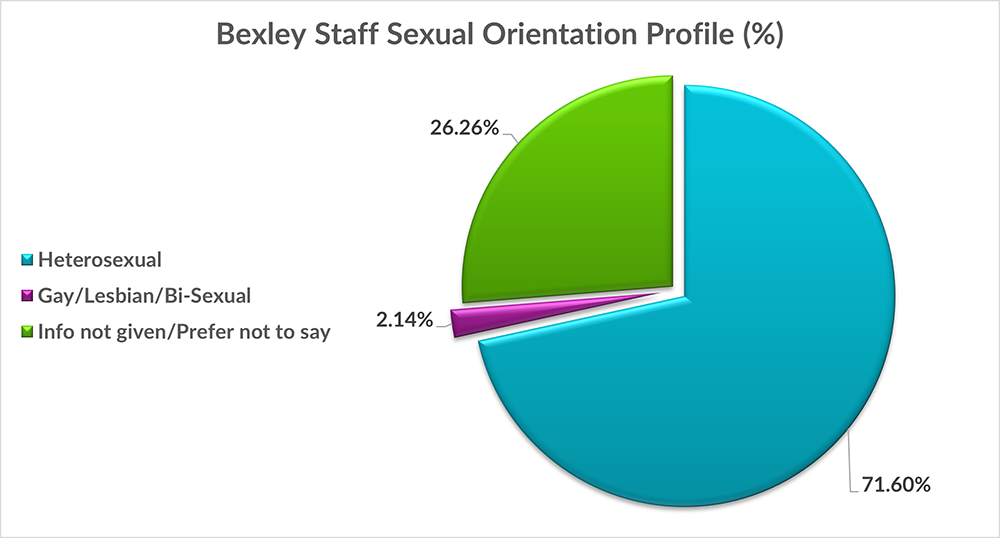
Sexual Orientation Pie Chart figures
Chart showing that 71.60% of the workforce are Heterosexual followed by 26.26% (prefer not to say/not given) then at 2.14% is Non-Heterosexual.
| Sexual Orientation | Hay | Non-Hay | Senior Managers |
|---|---|---|---|
| Heterosexual | 58900.00% | 471 | 44 |
| Gay/Lesbian/Bi-Sexual | 2100.00% | 10 | 2 |
| Info not given/Prefer not to say | 19300.00% | 198 | 14 |
Sexual Orientation by Grade Chart
Image
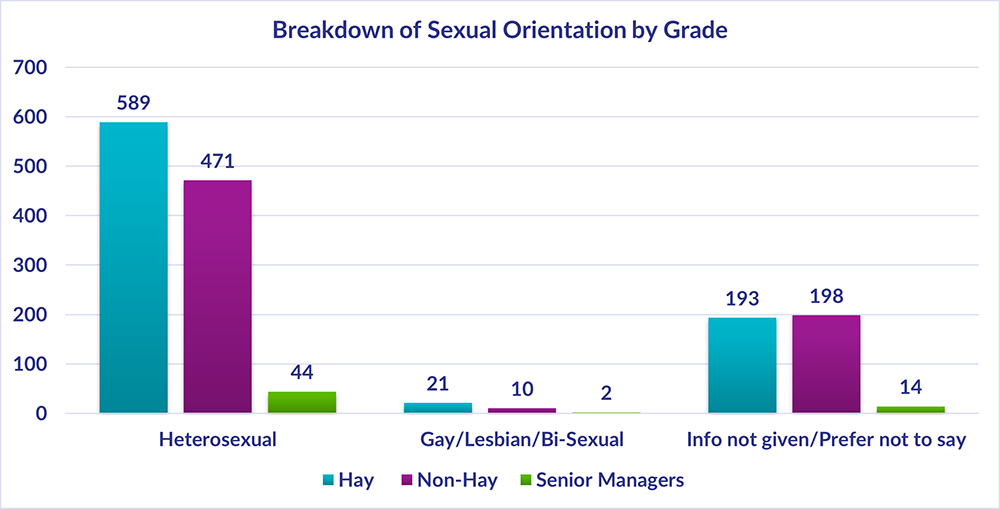
Sexual Orientation by Grade Chart figures
Chart showing the breakdown of sexual orientation by grade, a summary of the highest and lowest figures is 589 Hay, 471 Non-Hay and 44 Senior Managers are Heterosexual, whereas the lowest figures 21 Hay and 10 Non Hay and 2 Senior Managers are Gay/Lesbian/Bi-Sexual or Other.