8. Recruitment from 1 April 2023 to 31 March 2024
All vacant posts are filled through a competitive recruitment & selection process. The following tables show the profile of applicants for Council vacancies, through the recruitment process i.e. shortlisting and appointment. There was a total of 4075 applicants.
| Total Applicants | Applicants | Short-Listed | Appointed |
|---|---|---|---|
| Total | 407500.00% | 879 | 344 |
Recruitment total applicants bar chart
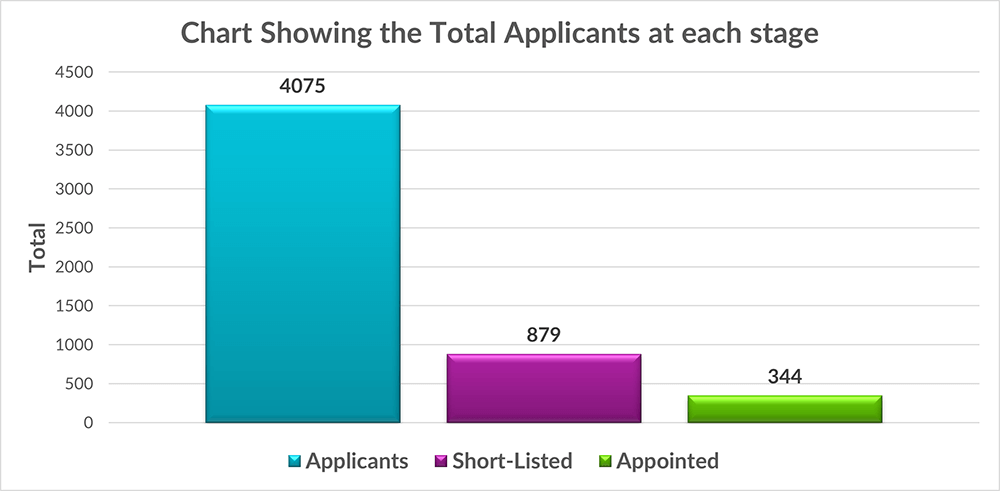
Recruitment total applicants bar chart figures
Chart showing that a total of 4075 applicants applied, of these 4075, 879 got short-listed and of those 879 that got shortlisted 344 were appointed.
| Ethnicity | Applicants | Short-Listed | Appointed |
|---|---|---|---|
| White | 1284 (31.51%) | 435 (49.49%) | 190 (55.23%) |
| BAME | 2381 (58.43%) | 374 (42.55%) | 123 (35.76%) |
| Unknown | 410 (10.06%) | 70 (7.96%) | 31 (9.01%) |
| Total | 407500.00% | 879 | 344 |
Total recruitment applicants by ethnicity bar chart
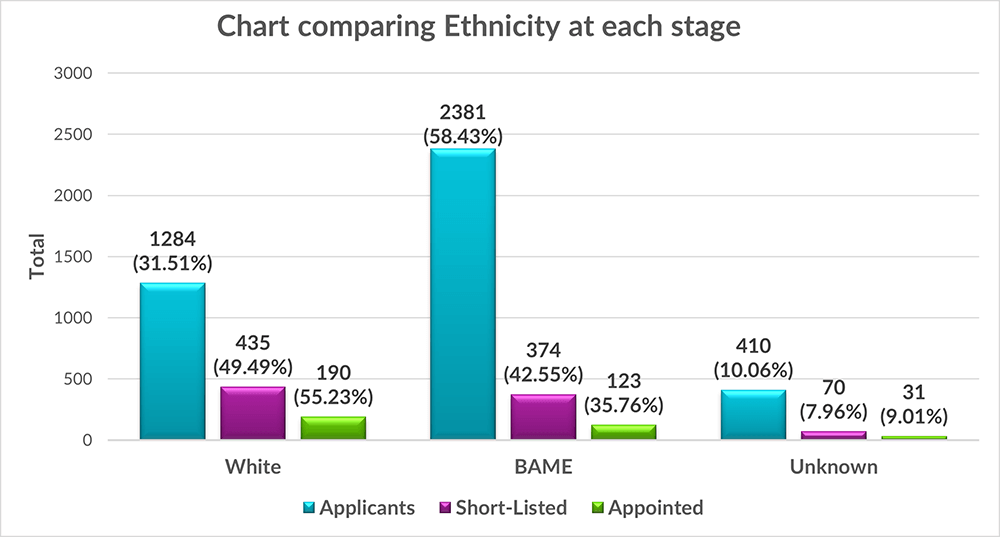
Total recruitment applicants by ethnicity bar chart figures
Chart showing that of the 1284 applicants who applied that were White, 190 of them got appointed compared to 2381 who were BAME 123 of them got appointed, finally 410 who didn't provide their ethnicity 31 of these got appointed.
| Disability/Incapacity | Applicants | Short-Listed | Appointed |
|---|---|---|---|
| Disability/Incapacity | 260 (6.38%) | 84 (9.56%) | 24 (6.98%) |
| None/Answer Not Given | 3815 (93.62%) | 795 (90.44%) | 320 (93.02%) |
| Total | 407500.00% | 879 | 344 |
Recruitment disability/incapacity bar chart
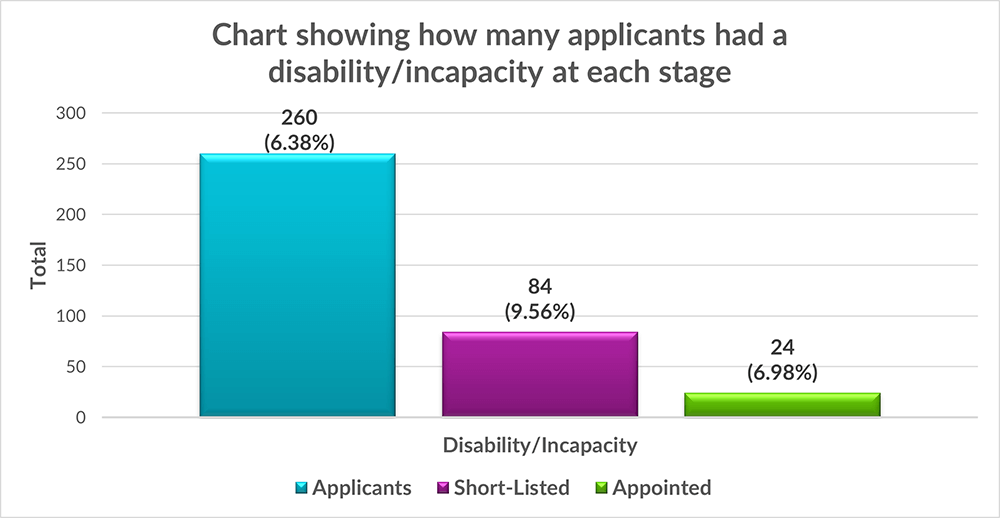
Recruitment disability/incapacity bar chart figures
Chart showing that 260 of the total applicants who applied stated they had a disability/incapacity of these 260, 24 of them got appointed.
| Gender | Applicants | Short-Listed | Appointed |
|---|---|---|---|
| Female | 2755 (67.61%) | 665 (75.65%) | 273 (79.36%) |
| Male | 1320 (32.39%) | 214 (24.35%) | 71 (20.64%) |
| Total | 407500.00% | 879 | 344 |
Total recruitment applicants by gender bar chart
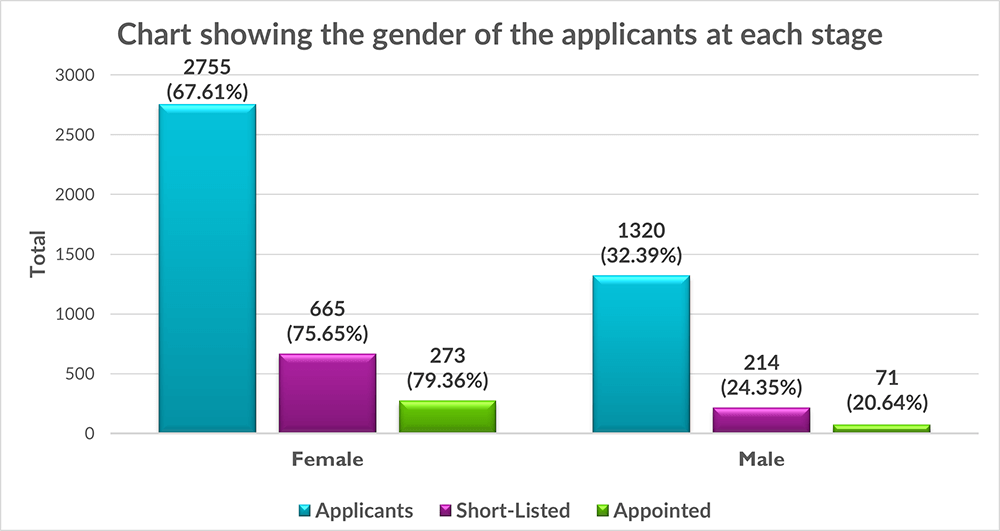
Total recruitment applicants by gender bar chart figures
Chart showing that a total of 2755 Females applied of these, 273 got appointed, meanwhile 1320 Males applied and 71 of these got appointed and finally 18 applicants got appointed didn't provide their gender.
| Age | Applicants | Short-Listed | Appointed |
|---|---|---|---|
| Under 20 | 62 (1.52%) | 11 (1.25%) | 4 (1.16%) |
| 20-39 | 2750 (67.48%) | 445 (50.63%) | 153 (44.48%) |
| 40-59 | 1130 (27.73%) | 371 (42.21%) | 155 (45.06%) |
| 60+ | 83 (2.04%) | 33 (3.75%) | 14 (4.07%) |
| Unknown | 50 (1.23%) | 19 (2.16%) | 18 (5.23%) |
| Total | 4075 | 879 | 344 |
Total recruitment applicants by age bar chart
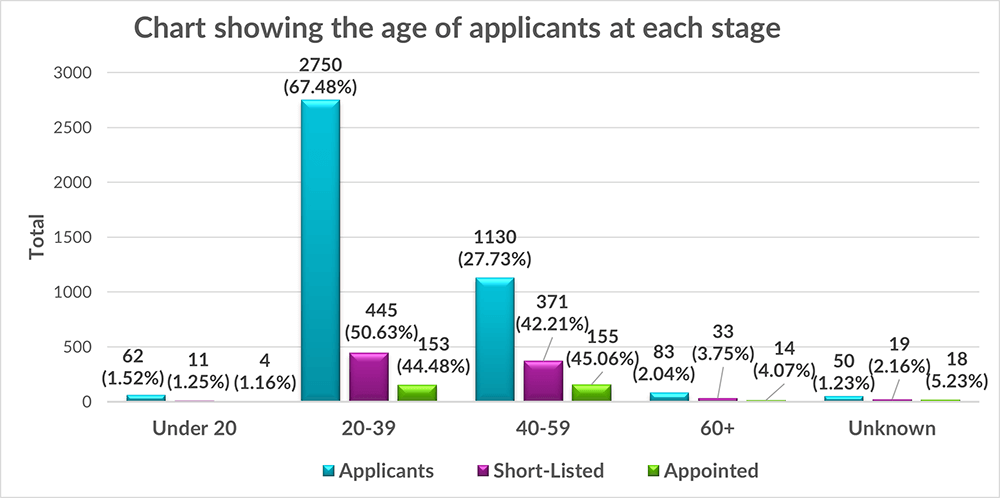
Total recruitment applicants by age figures
Chart showing the most appointed age group is 40-59 (155) followed by 20-39 (153) then 60+ (14) and finally under 20's (4). 18 people who got appointed didn't provide their age.
| Sexual Orientation | Applicants | Short-Listed | Appointed |
|---|---|---|---|
| Heterosexual | 3228 (79.21%) | 715 (81.34%) | 274 (79.65%) |
| Gay/Lesbian/Bi-Sexual | 204 (5.01%) | 38 (4.32%) | 17 (4.94%) |
| Prefer to Self-Describe | 27 (0.66%) | 7 (0.80%) | 4 (1.16%) |
| Not Given/Prefer Not to Say | 616 (15.12%) | 119 (13.54%) | 49 (14.94%) |
| Total | 4075 | 879 | 344 |
Total recruitment applicants by sexual orientation bar chart
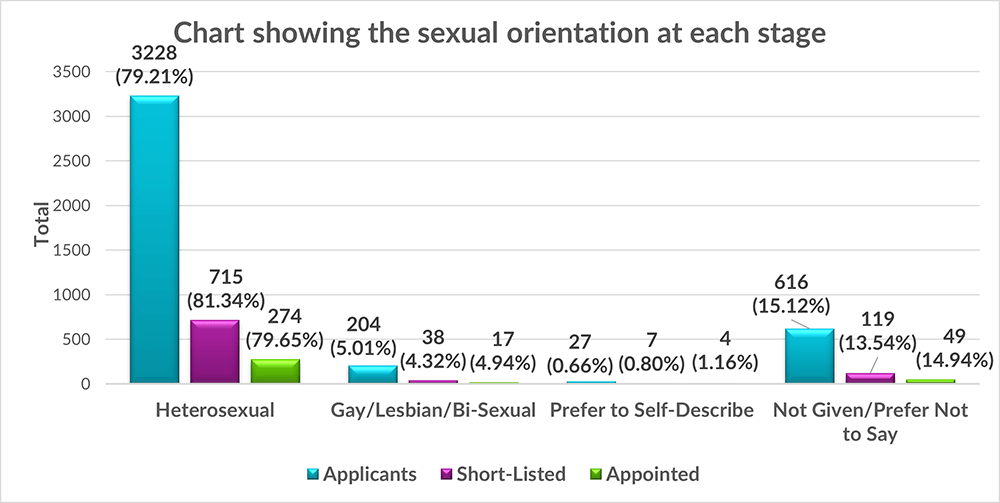
Total recruitment applicants by sexual orientation bar chart figures
Chart showing that a total of 274 people were appointed who were heterosexual, followed by 49 people who preferred not to answer, 17 people who got appointed were non-heterosexual and finally 4 appointed staff preferred to self-describe.
| Religion | Applicants | Short-Listed | Appointed |
|---|---|---|---|
| Christian | 1851 (45.42%) | 384 (43.69%) | 155 (45.06%) |
| Buddhism, Hinduism, Islam (Muslim), Jehovah’s Witness, Judaism, Sikhism (Other Religion) | 762 (18.70%) | 94 (10.69%) | 22 (6.40%) |
| None/Not Stated | 1462 (35.88%) | 401 (45.62%) | 167 (48.55%) |
| Total | 407500.00% | 879 | 344 |
Total recruitment applicants by religion bar chart
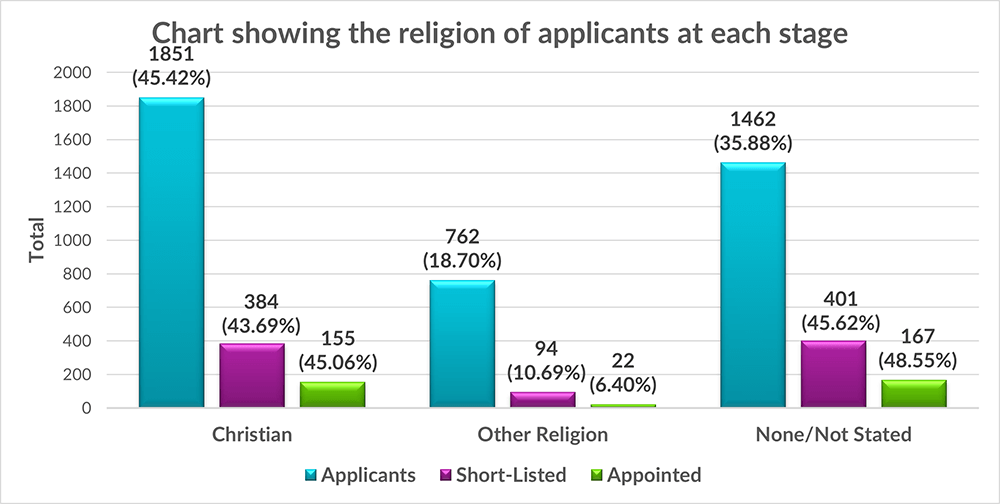
Total recruitment applicants by religion bar chart figures
Chart showing that of the 344 who got appointed 155 of them were Christians, 167 did not state their religion and 22 were Non-Christian.