5. Religion
| Religion | Amount (%) |
|---|---|
| Christian | 45.33% |
| Buddhism, Hinduism, Islam (Muslim), Jehovah’s Witness, Judaism, Sikhism (Other Religion) | 8.11% |
| None/Info Not Given | 46.56% |
Religion pie chart
Image
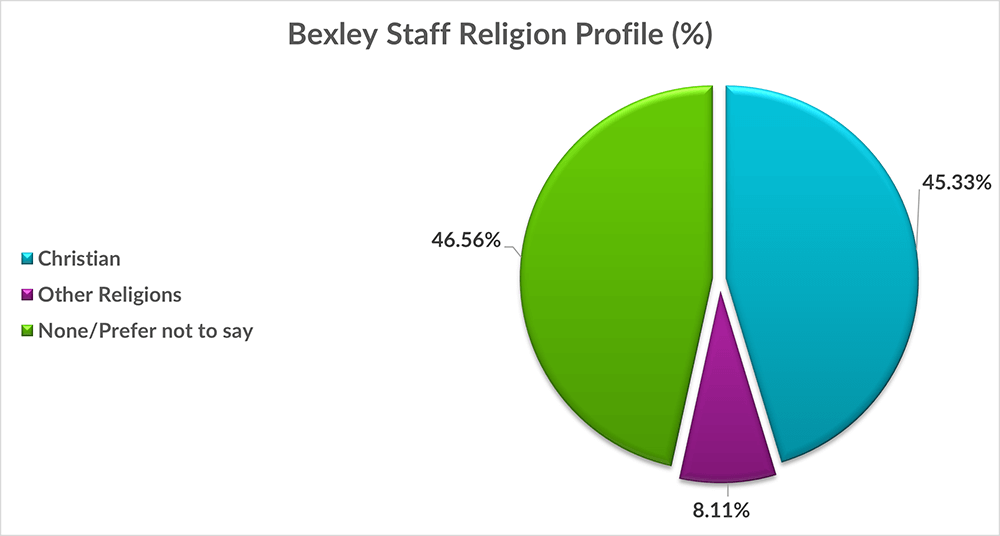
Religion pie chart figures
Chart showing that 46.56% have not provided/not wanted to provide their religion, this is followed by Christianity (45.33%) then Other religions follow (8.11%).
| Religion | Hay | Non-Hay | Senior Managers |
|---|---|---|---|
| Christian | 38300.00% | 287 | 29 |
| Buddhism, Hinduism, Islam (Muslim), Jehovah’s Witness, Judaism, Sikhism (Other Religion) | 6600.00% | 50 | 9 |
| None/Info Not Given | 35400.00% | 342 | 22 |
Religion by grade chart
Image
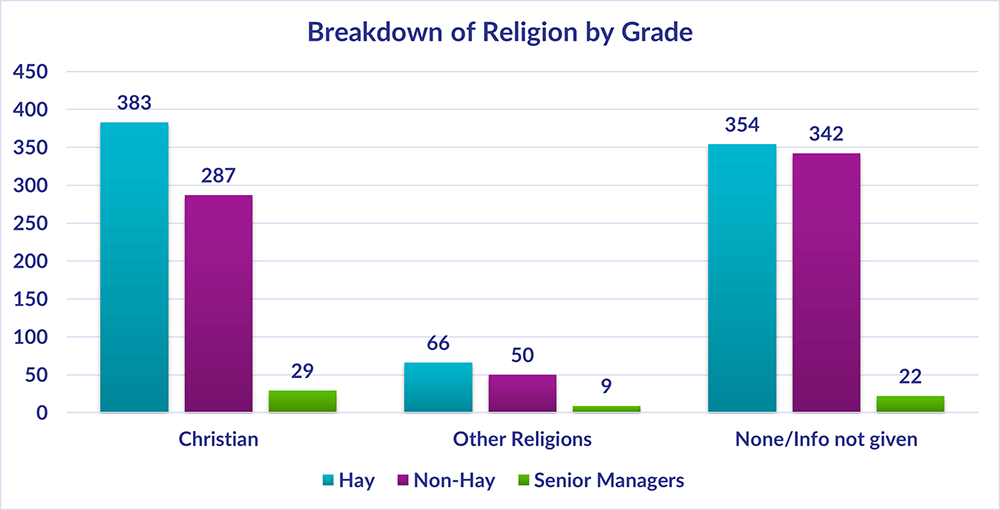
Religion by grade chart figures
Chart showing the breakdown of religion by grade, a summary of the highest and lowest figures is 383 Hay, 287 Non-Hay and 29 Senior Managers are Christian, whereas the lowest figures 66 Hay and 50 Non Hay and 9 Senior Managers have Other Religion selected.