9. Leavers
169 employees left the Council between April 2023 and March 2024. This is broken down by personal characteristic below.
| Ethnicity | Total (%) |
|---|---|
| White | 55.62% |
| BAME | 22.63% |
| Information Not Obtained | 17.75% |
Total of staff leavers by ethnicity pie chart
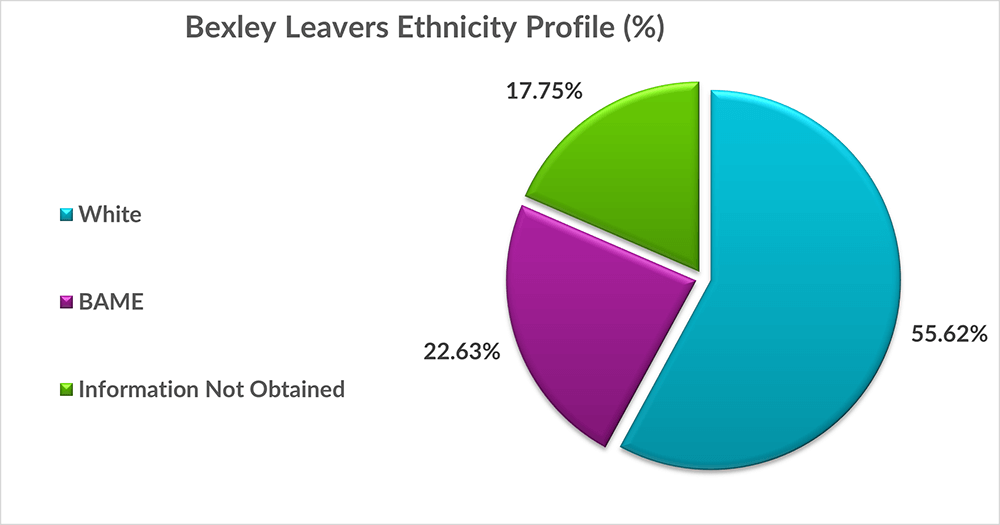
Total of staff leavers by ethnicity pie chart figures
Chart showing the highest ethnicity group for LBB Leavers is White (55.62%) compared to BAME (22.63%) and Ethnicity not provided (17.75%).
| Age Profile | Amount (%) |
|---|---|
| Under 20 | 0.00% |
| 20-39 | 36.69% |
| 40-59 | 42.60% |
| 60+ | 20.71% |
Total of staff leavers by age pie chart
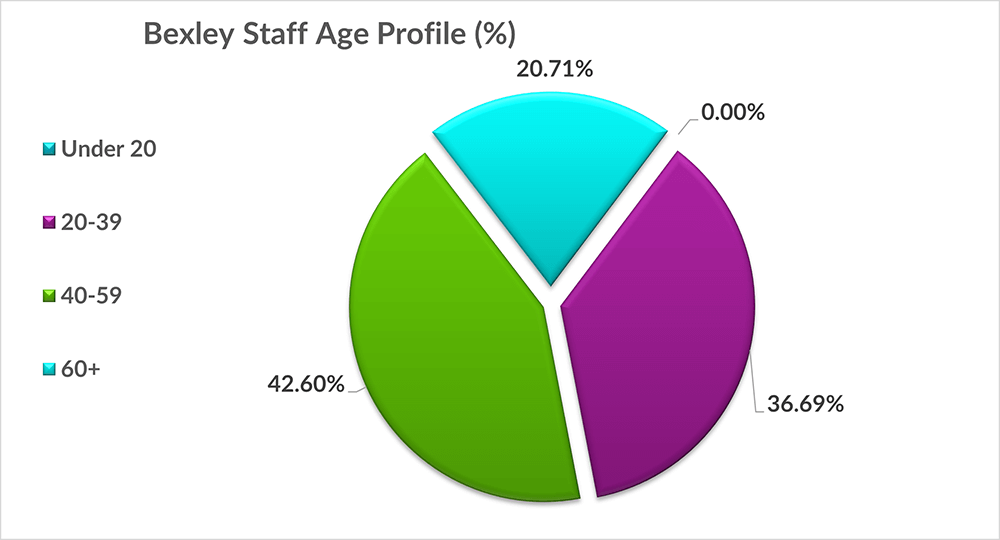
Total of staff leavers by age pie chart figures
Chart showing the highest age profile of leavers being 40-59 with 42.60%, while the other profiles range from 36.69% (20-39) to 20.71% (60+).
| Sexual Orientation | Amount (%) |
|---|---|
| Heterosexual | 74.56% |
| Gay/Lesbian/Bi-Sexual/Prefer to Self-Describe | 414.00% |
| Info not given/Prefer not to say | 2130.00% |
Total of staff leavers by sexual orientation pie chart
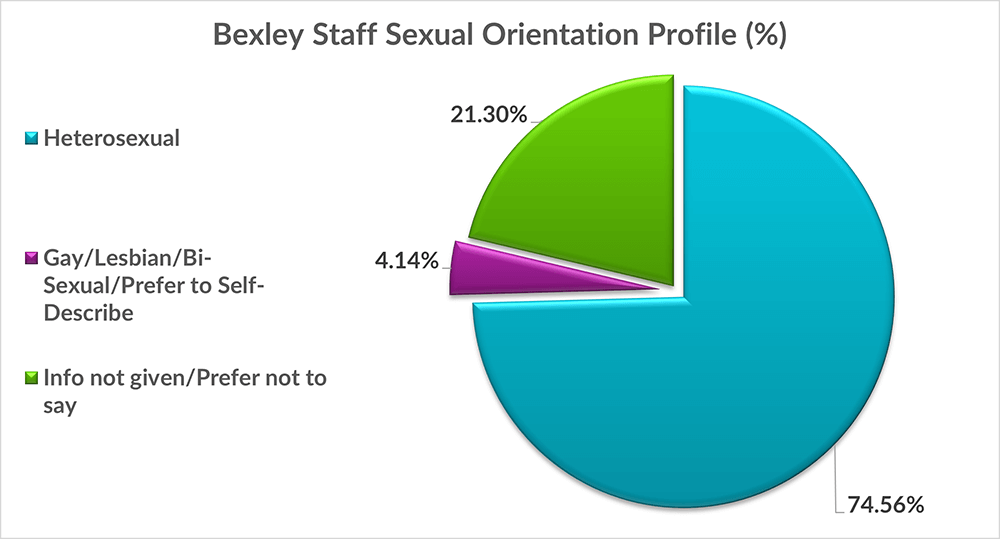
Total of staff leavers by sexual orientation pie chart figures
Chart showing that 74.56% of the leavers are Heterosexual followed by 21.30% (prefer not to say/not given) then at 4.14% is Non-Heterosexual.
| Religion | Amount (%) |
|---|---|
| Christian | 46.75% |
| Buddhism, Hinduism, Islam (Muslim), Jehovah’s Witness, Judaism, Sikhism (Other Religion) | 9.47% |
| None/Prefer not to say | 43.79% |
Total of staff leavers by religion pie chart
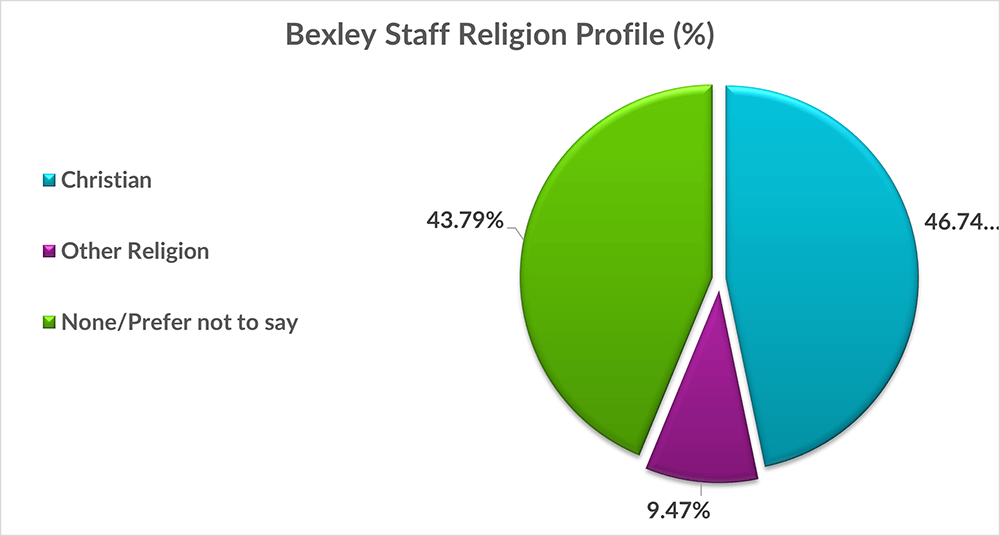
Total of staff leavers by religion pie chart figures
Chart showing that 46.75% are Christian, this is followed by staff who didn't provide their religion or don't have a religion (43.79%) then Other religions follow (9.47%).
| Disability/Incapacity | Amount (%) |
|---|---|
| Yes | 5.33% |
| No/Info not obtained | 94.67% |
Total of staff leavers by disability/incapacity pie chart
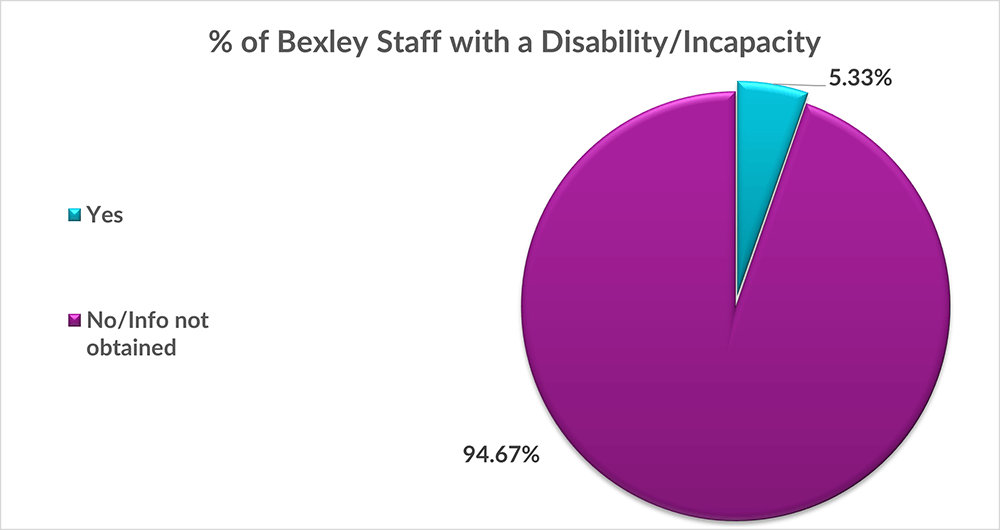
Total of staff leavers by disability/incapacity pie chart figures
Chart showing the percentage of workforce with a disability/incapacity (5.33%) compared to those who don't or didn't submit an answer (94.67%).
| Gender | Amount (%) |
|---|---|
| Female | 68.64% |
| Male | 31.36% |
Total of staff leavers by gender pie chart
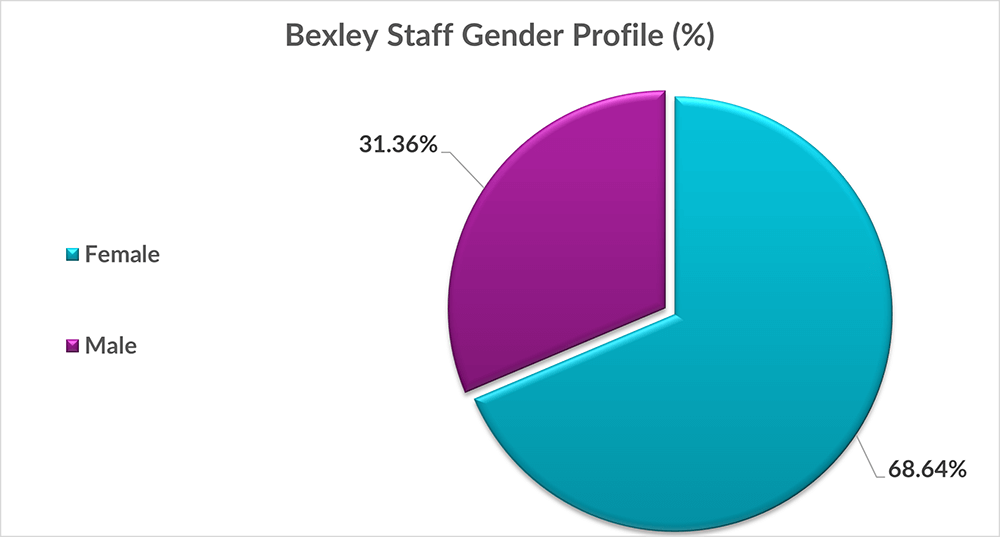
Total of staff leavers by gender pie chart figures
Chart showing a majority of the workforce at Bexley are Female (68.64%) compared to Male (31.36%).