6. Disability/Incapacity
| Disability/Incapacity | Amount (%) |
|---|---|
| Yes | 6.42% |
| No/Info not obtained | 93.58% |
Disability/incapacity pie chart
Image
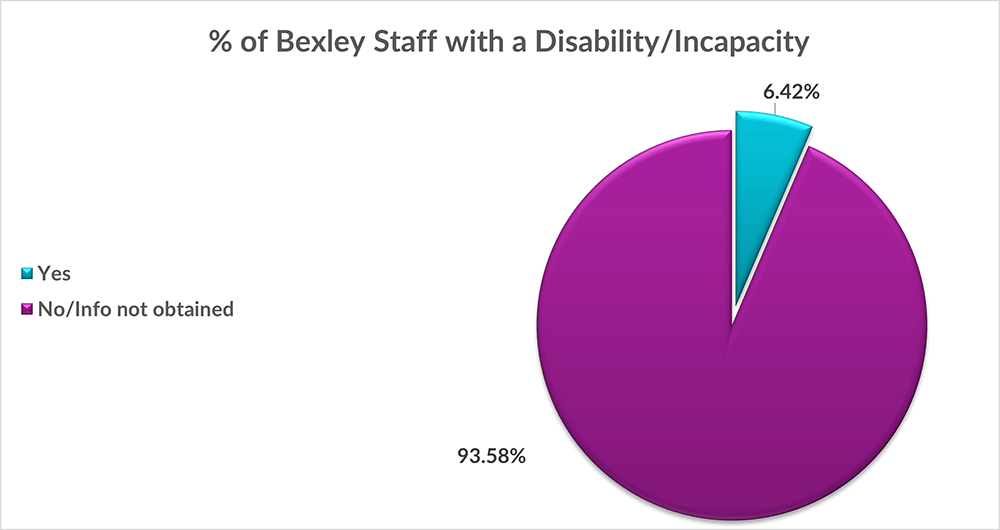
Disability/Incapacity pie chart figures
Chart showing the % of workforce with a disability/incapacity (6.42%) compared to those who don't or didn't submit an answer (93.58%).
| Disability/Incapacity | Hay | Non-Hay | Senior Managers |
|---|---|---|---|
| Yes | 3900.00% | 57 | 3 |
| No/Info not obtained | 76400.00% | 622 | 57 |
Disability by grade chart
Image
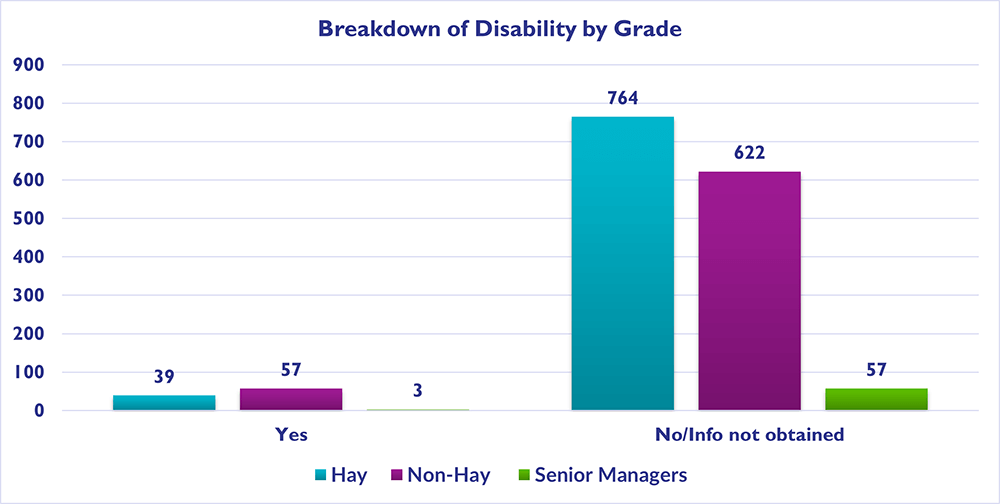
Disability by grade chart figures
Chart showing the breakdown of disability by grade, a summary of the highest and lowest figures is 764 Hay, 622 Non-Hay and 57 Senior Managers don't have an incapacity/disability, whereas the lowest figures 39 Hay and 57 Non Hay and 3 Senior Managers have a incapacity/disability.