2. Ethnicity
| Ethnicity | Total (%) |
|---|---|
| Asian (Indian, Pakistani, Any other Asian) | 4.15% |
| Black (Caribbean, African, Other Black) | 11.93% |
| Other | 0.78% |
| Mixed | 2.33% |
| White | 67.77% |
| Not Yet Obtained | 13.04% |
Bexley Staff Ethnicity profile pie chart
Image
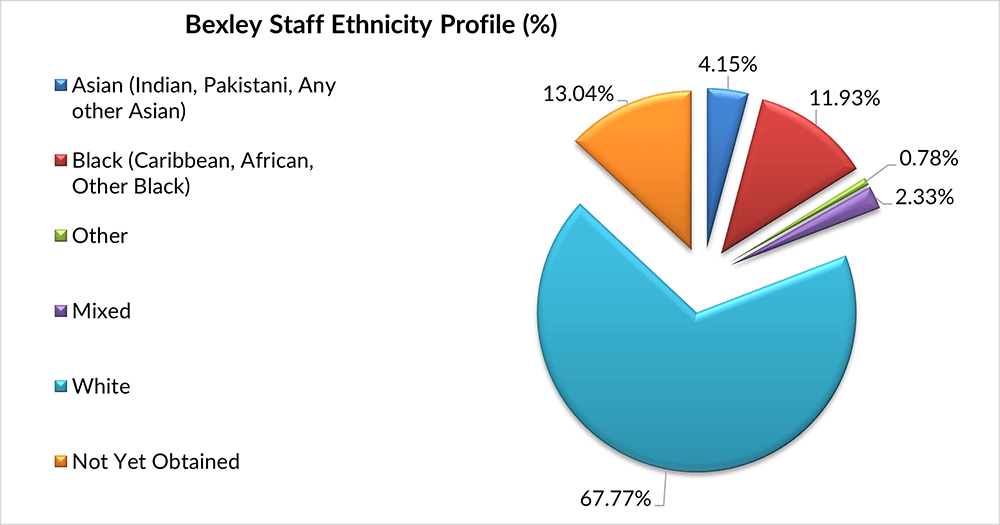
Bexley Staff Ethnicity profile pie chart figures
Chart showing the highest ethnicity group for LBB is White at 67.77%, while the other groups range from 0.78% (Other) to 13.04% (Not Yet Obtained).
| Ethnicity | Hay | Non-Hay | Senior Managers |
|---|---|---|---|
| Asian (Indian, Pakistani, Any other Asian) | 3500.00% | 24 | 5 |
| Black (Caribbean, African, Other Black) | 128 | 55 | 1 |
| Other | 9 | 3 | 0 |
| Mixed | 20 | 14 | 2 |
| White | 514 | 488 | 43 |
| Not Yet Obtained | 97 | 95 | 9 |
Ethnicity Breakdown by Grade Chart
Image
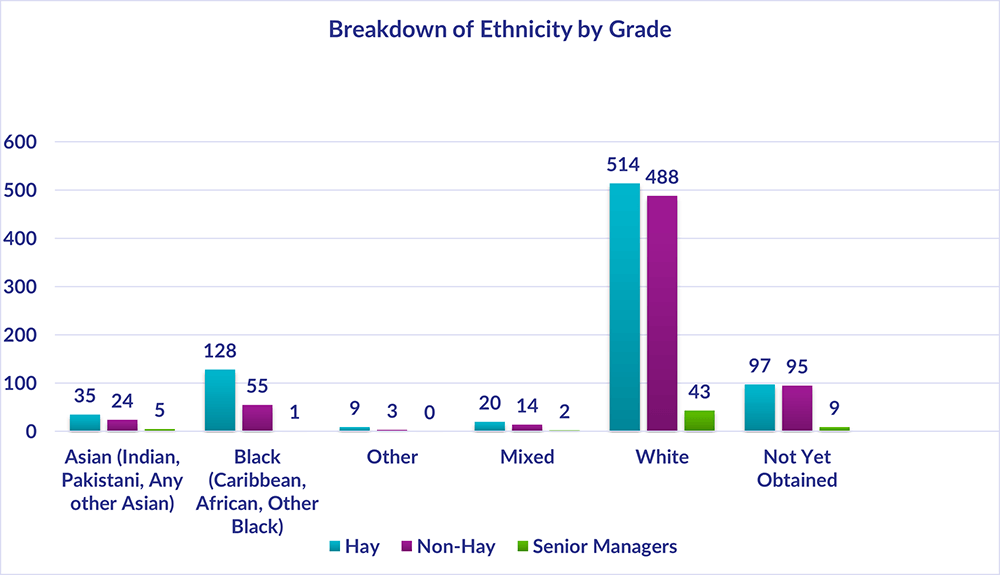
Ethnicity Breakdown by grade chart figures
Chart showing the breakdown of ethnicity by grade, a summary of the highest and lowest figures is 514 Hay, 488 Non-Hay and 43 Senior Managers have the ethnicity of White, whereas the lowest figures 9 Hay and 3 Non-Hay have the ethnicity of Other.