7. Gender
| Gender | Amount (%) |
|---|---|
| Male | 22.50% |
| Female | 77.50% |
Gender Pie Chart
Image
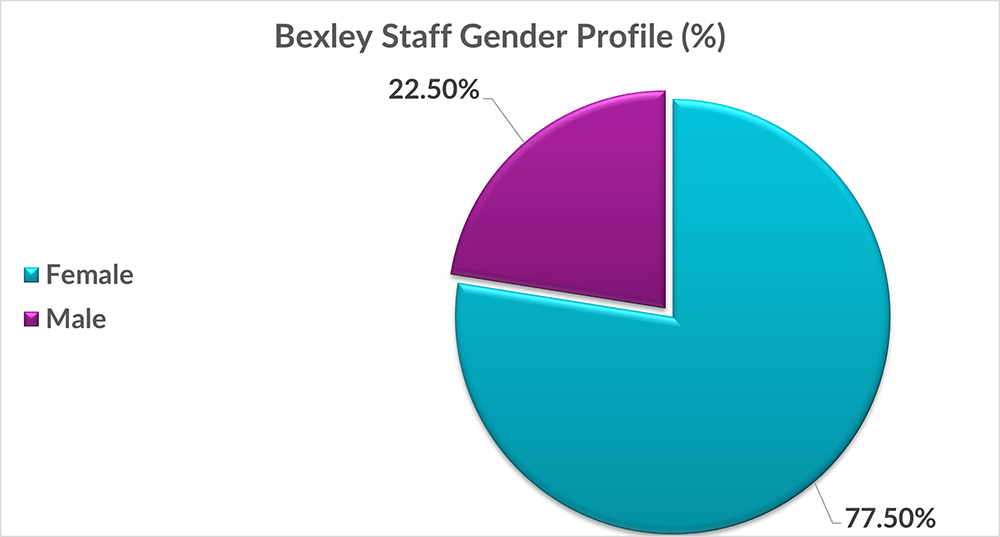
Gender pie chart figures
Chart showing a majority of the workforce at Bexley are Female (77.50%) compared to Male (22.50%).
| Gender | Hay | Non-Hay | Senior Managers |
|---|---|---|---|
| Male | 18900.00% | 136 | 22 |
| Female | 61400.00% | 543 | 38 |
Gender by grade chart
Image
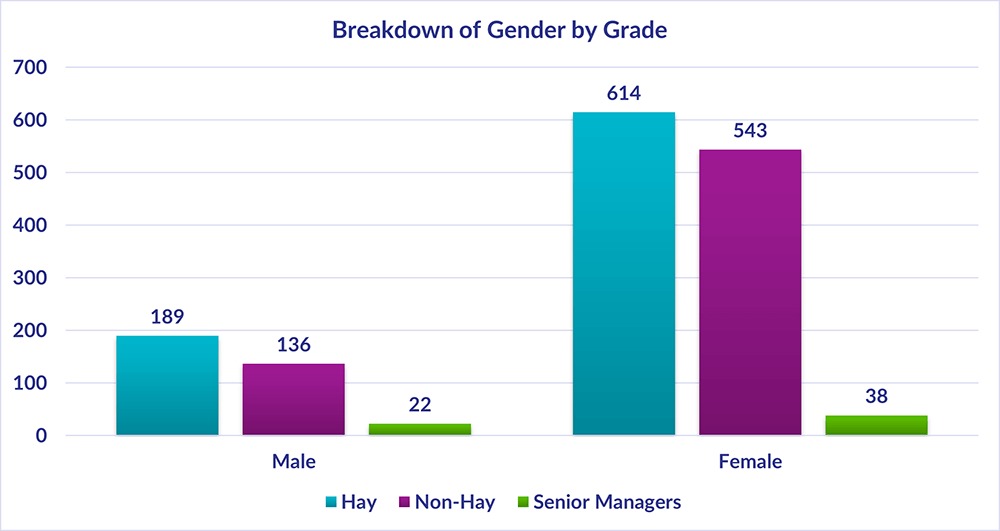
Gender by grade chart figures
Chart showing the breakdown of gender by grade, a summary of the highest and lowest figures is 614 Hay, 543 Non-Hay and 38 Senior Managers are Female, whereas the lowest figures 189 Hay and 136 Non Hay and 22 Senior Managers are Male.